TL;DR: Amazon Brand Analytics shows your own search funnel, while reverse ASIN tools reveal competitors' keyword coverage. Combining these two datasets helps you separate keywords with high demand and strong relevance from competitive traps, so you can choose the right action: defend, expand, own, or test.
Key Takeaways
- Brand Analytics gives first-party search funnel data; reverse ASIN tools reveal competitor keyword coverage.
- Combining both lets you score keywords on three signals: demand, brand fit, and competitive visibility.
- A four-zone map (Defend, Expand, Own, Test/Ignore) turns raw data into a clear action plan.
- Use the keyword graduation loop to validate competitor clues with first-party proof before changing listings.
- Set up a weekly operating system so you stay ahead of competitors and search demand shifts.
Table of Contents
- Brand Analytics and Reverse ASIN Solve Different Halves of the Same Search Problem
- Know What the Data Means Before You Combine It
- Build One Query-Level Dataset From Brand Analytics and Reverse ASIN
- Use Three Signals to Judge a Keyword: Demand, Fit, and Competitive Visibility
- Turn the Combined Data Into a Four-Zone Keyword Opportunity Map
- Diagnose the Funnel Before You Change the Listing
- Use Reverse ASIN to Explain Changes You See in Brand Analytics
- The Keyword Graduation Loop: From Competitor Clue to First-Party Proof
- Decide What to Do With Each Validated Keyword
- Build a Weekly Brand Analytics + Reverse ASIN Operating System
- Five Data Mistakes That Can Break the Combined Analysis
- What Brand Analytics Can Prove and What Reverse ASIN Can Only Suggest
- A Practical Decision Framework for Common Amazon Search Scenarios
- FAQ
- References
Note on marketplaces: This guide is specifically optimized for the US market.
If you sell on Amazon, you know that search terms change fast. Your own listing data only tells you half the story. To grow, you need to understand where competitors are winning and why. That is exactly why combining Amazon Brand Analytics with reverse ASIN tools is so powerful. In this guide, you will learn how to merge those two data sources into a single, actionable keyword strategy. For a broader look at the full process, check out our reverse ASIN strategy guide.
Brand Analytics and Reverse ASIN Solve Different Halves of the Same Search Problem
Amazon Brand Analytics and reverse ASIN tools answer different questions. Brand Analytics reports what shoppers do once they search on Amazon; it shows impressions, clicks, cart adds, and purchases for your brand's terms. Reverse ASIN starts from a competitor's product and reveals the keywords that product ranks for. Neither dataset is complete alone; together they form the foundation of a data-driven keyword strategy.
Brand Analytics Shows What Is Happening Inside Your Search Funnel
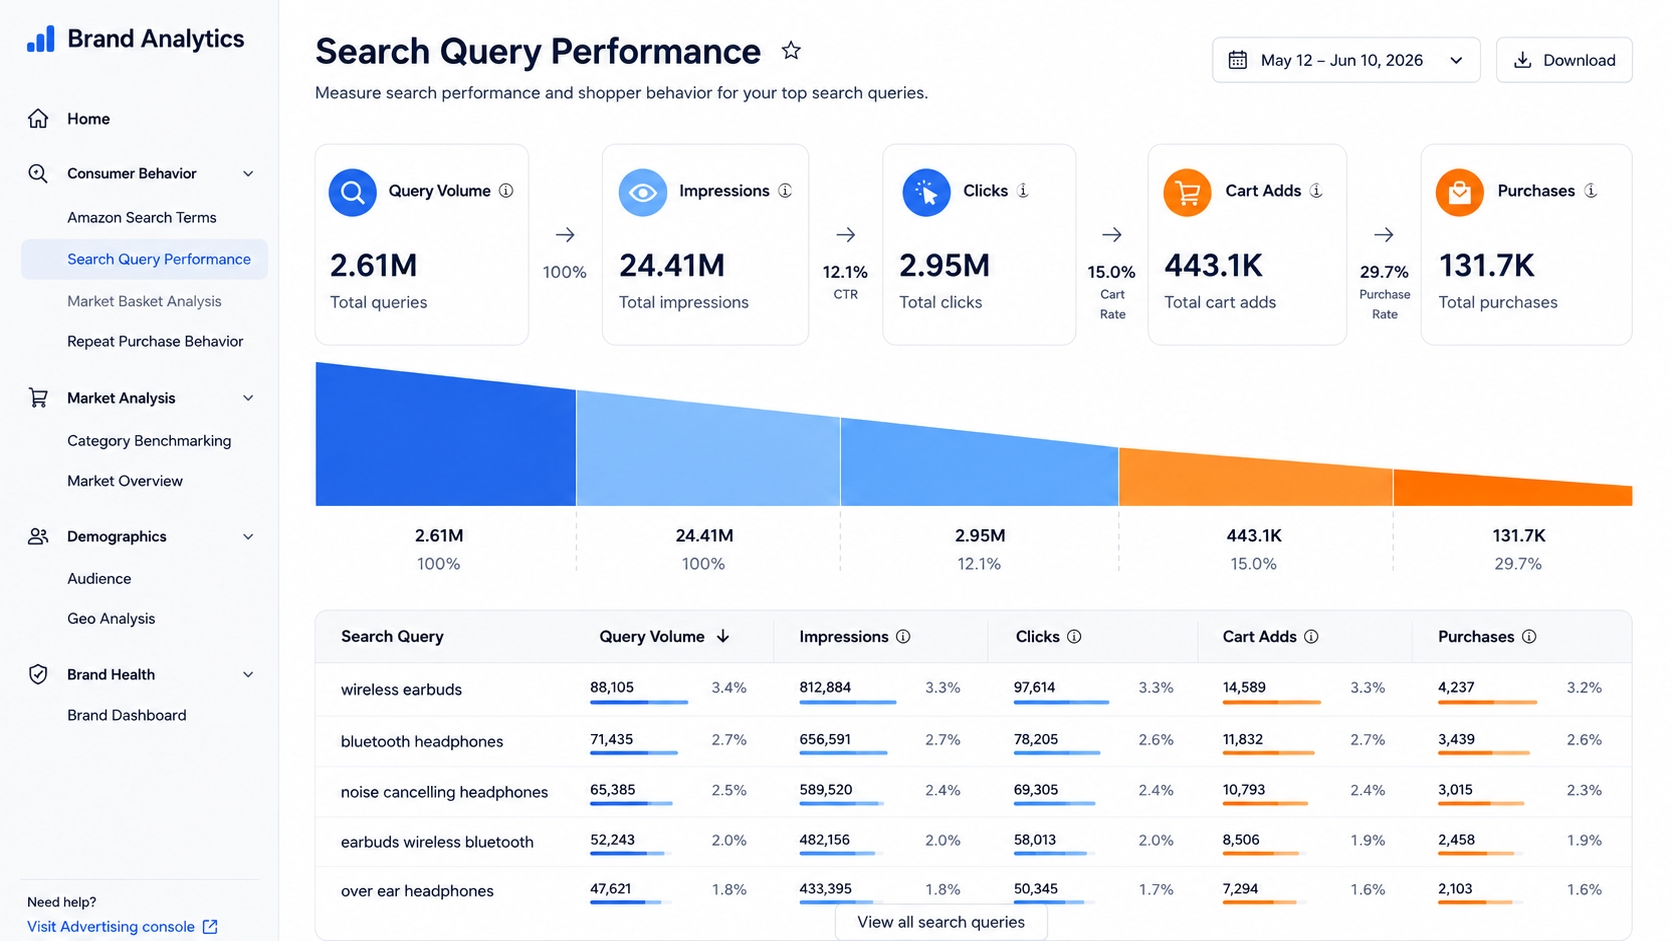
For brand-registered sellers, Brand Analytics provides first-party search data from within Amazon. It shows exactly how many shoppers searched for a term, how many saw your product, clicked it, added it to the cart, and purchased it. That funnel is the closest thing to ground truth for your brand's search performance.
Demand
In Brand Analytics, query volume tells you how many unique shoppers searched for a term in a given period. This is the best available measurement of true Amazon demand. However, high demand doesn't mean you'll win; it just means there are shoppers to win over.
Visibility
Impressions show how often your ASIN appeared in search results for the query. Compare impressions to query volume to estimate your search-result share. A low share usually means competitors dominate the first page or your ASIN is not indexed for the term.
Click Engagement
Clicks and click-through rate (CTR) reveal whether shoppers who saw your product found it compelling enough to investigate further. High impressions with weak clicks often point to a listing-appeal problem, not a demand problem.
Cart and Purchase Behavior
Cart adds and purchases close the loop. These metrics show how well your detail page converts search intent into actual sales. A large gap between clicks and purchases may indicate a price, offer, or listing-quality issue.
Reverse ASIN Shows What Is Happening Outside Your Brand
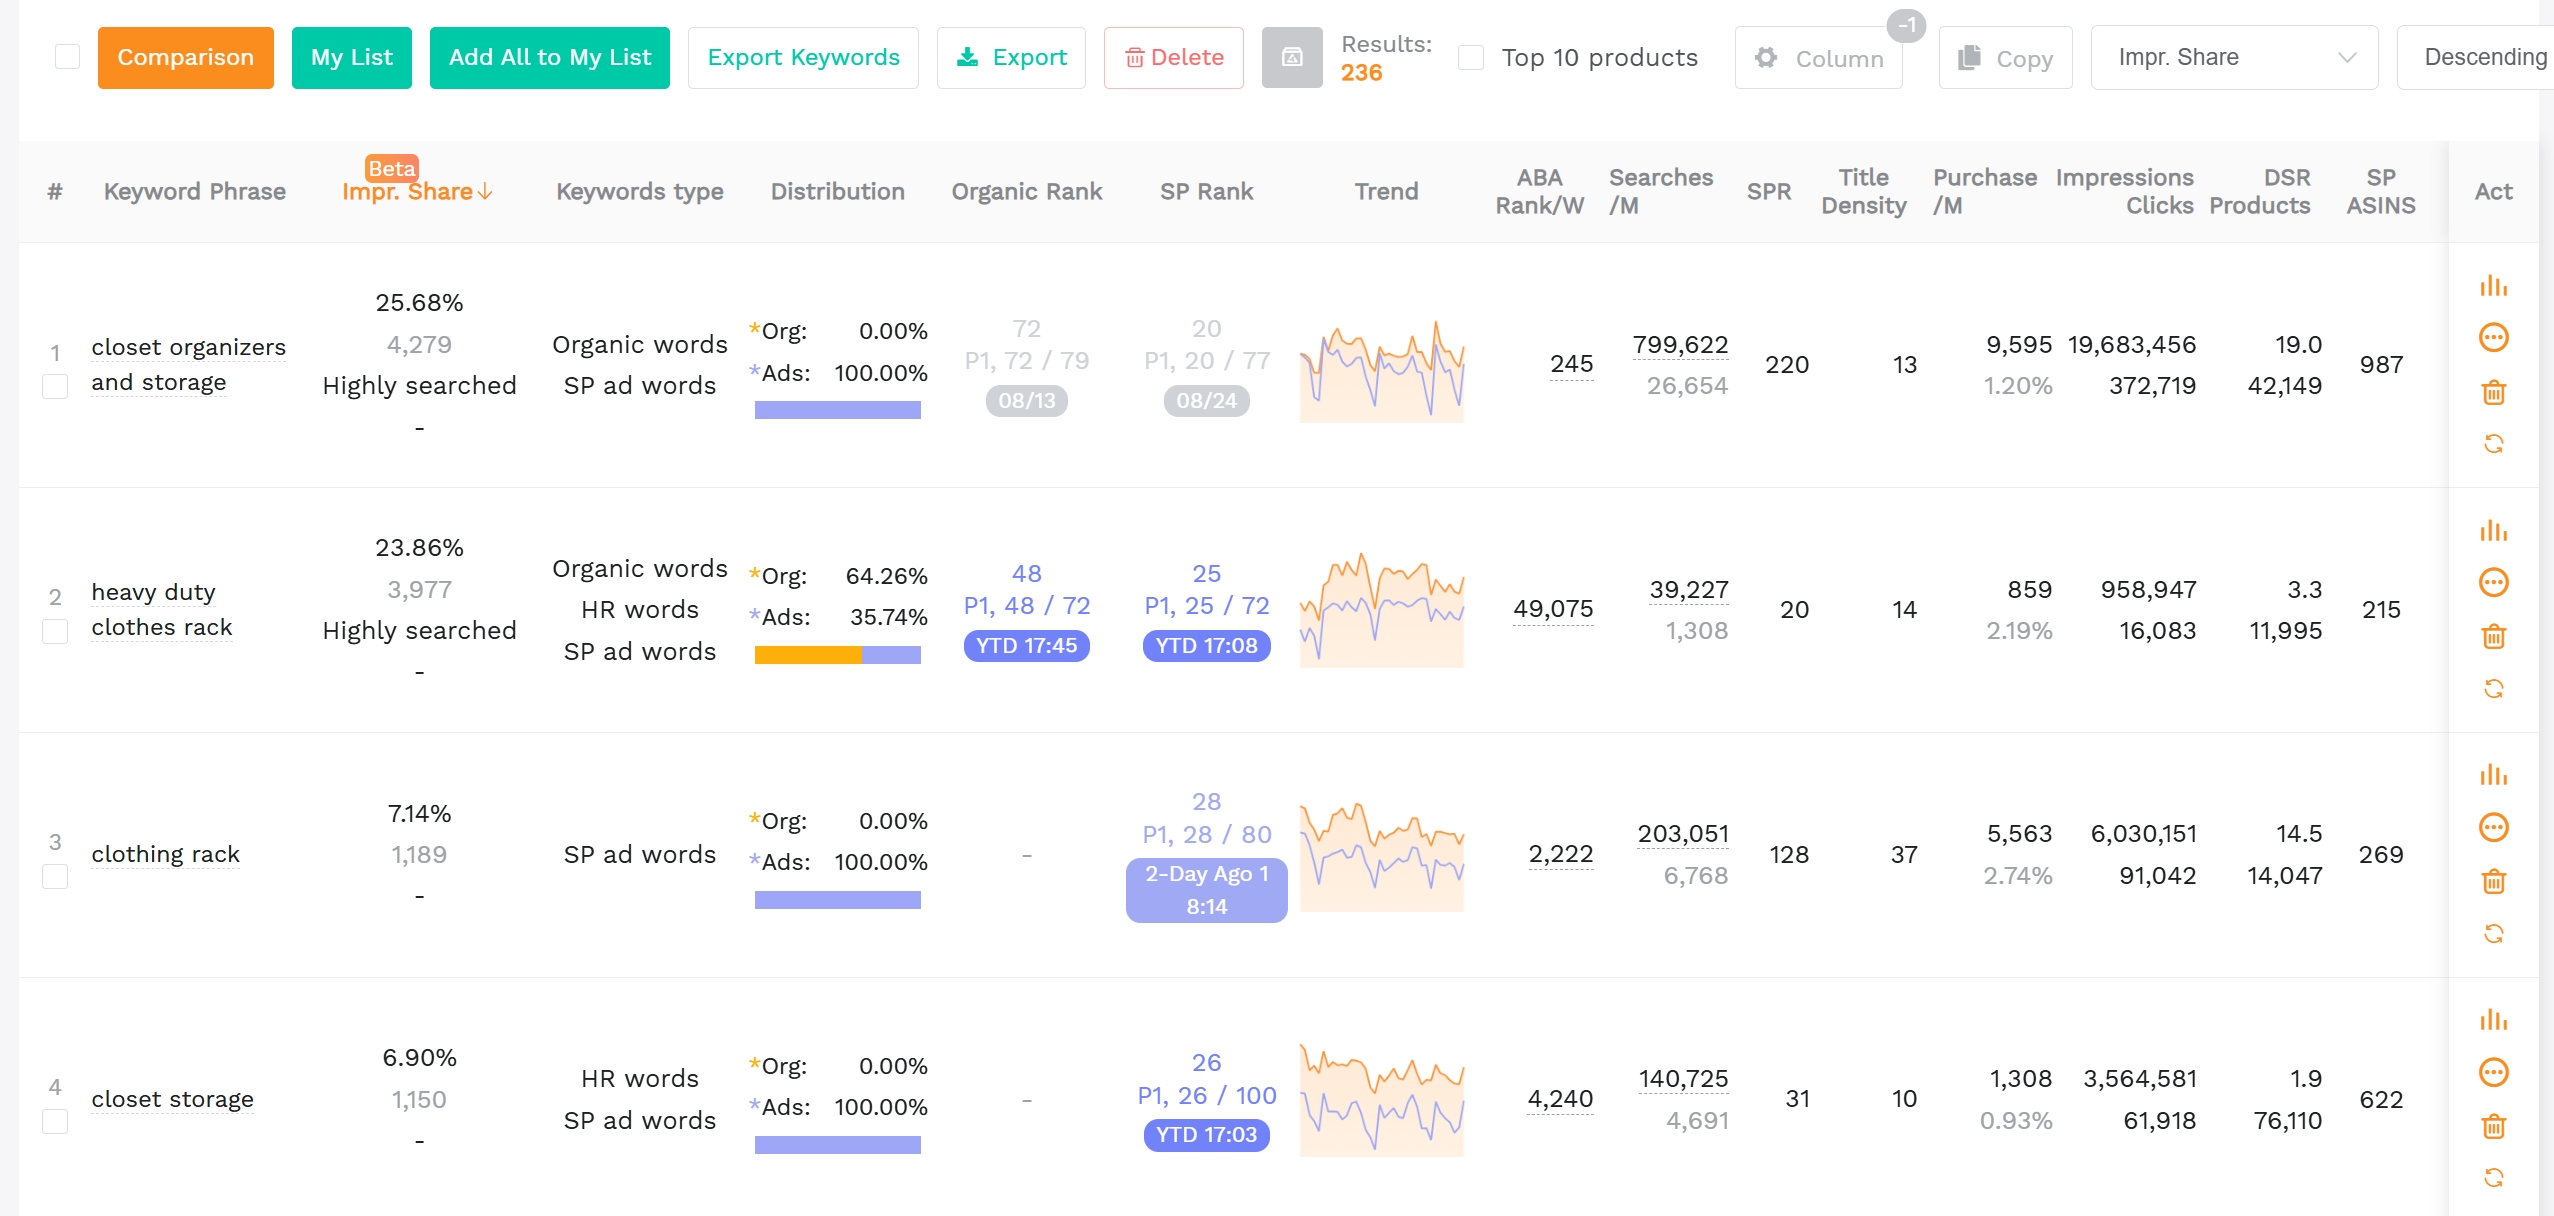
Reverse ASIN tools, such as SellerSprite's keyword reverse tool, let you start with a competitor's ASIN and see which keywords that ASIN ranks for. This opens a window into the competitive keyword universe that your own Brand Analytics can't show.
Competitor Keyword Coverage
By entering a competitor ASIN, you can see the set of keywords they currently target organically. This reveals which phrases they're winning, which ones they've neglected, and where you might find untapped opportunities.
Organic Ranking Positions
Organic rank tells you where a competitor's ASIN appears in natural results. If they rank on page one and you don't, that's a clear gap. The rank data also helps you track whether a competitor is improving or losing ground over time.
Sponsored Visibility
Some reverse ASIN tools show whether an ASIN appears in sponsored placements. This tells you if a competitor is buying ads for the keyword. Knowing sponsored presence helps you gauge paid pressure and decide whether you need to bid more aggressively.
Competitor-Specific Keyword Clusters
Reverse ASIN groups keywords by relevance, making it easy to spot product-fit clusters. For example, a competitor may rank for wireless earbuds as well as sport earbuds, revealing adjacent markets you could enter with a new variation or a listing update.
The Missing Layer Is the Overlap Between First-Party and Competitor Data
Brand Analytics tells you what shoppers do with your ASIN for a query, but not whether competitors are also winning that query. Reverse ASIN tells you who ranks for what, but not how well your product converts. Overlaying the two datasets reveals where you already have proof of demand but lack competitive visibility, or where competitors have visibility but your brand hasn't yet established fit.
Why Neither Dataset Is Enough on Its Own
Relying only on Brand Analytics leaves blind spots for competitor keywords; relying only on reverse ASIN shows rankings but not actual conversion patterns. Combining both lets you allocate resources to keywords where both demand and your competitive position justify action. This is the foundation for the keyword opportunity map later in this guide.
Know What the Data Means Before You Combine It
Definitions matter. Before merging Brand Analytics and reverse ASIN outputs, you need to understand the exact metric definitions in each tool. Otherwise, you may compare apples to oranges and make poor decisions.
Start With Search Query Performance
Search Query Performance (SQP) is one of the most useful Brand Analytics reports. It provides query-level metrics for your brand. You can export it from Brand Analytics in Seller Central. Let's break down the columns.
Query Volume
This is the number of unique queries made by shoppers in the report period. It tells you overall demand for the search term. Higher volume usually means more potential traffic, but it also often means more competition.
Impressions
Impressions show how many times your product appeared in search results for that query. This is your starting point for visibility. If impressions are far lower than query volume, your ASIN may not be indexed or may be buried beyond page one.
Clicks
Clicks are the number of times shoppers clicked on your product after seeing it. Click-through rate (clicks ÷ impressions) is the key engagement metric. It helps you judge whether your search-result presence is attractive.
Cart Adds
Cart adds indicate purchase intent. Shoppers added your product to the cart from search results or the detail page. A low cart-add rate suggests the product or offer doesn't meet the expectation set by the search query.
Purchases
Purchases are the final conversion. Compare purchases to cart adds to see if there is friction at checkout. This metric gives you actual sales evidence for the query and is the strongest first-party signal.
Use the ASIN View to Move From Brand-Level to Product-Level Analysis
The ASIN view in SQP lets you segment those same metrics by individual ASIN. This is critical because your brand may have multiple products, and a keyword may be relevant to only one. By reviewing ASIN-level data, you can pinpoint which product is underperforming and avoid changing irrelevant listings.
Use Query Detail to See Who Else Is Winning the Search
The Query Detail view adds a competitive layer. For each query, Amazon shows a list of the top-performing ASINs, including your product and your competitors. This helps you see exactly who is capturing the search.
Your ASIN
You can see your own product's position in the top-performing ASIN list. If your ASIN is absent, you know you aren't in the top few results for that query.
Top-Performing ASINs
Amazon identifies the best-performing ASINs for each query based on sales and other factors. This is a great source of competitor ASINs for reverse ASIN analysis, because these are the products shoppers actually buy.
Price and Detail-Page Context
The Query Detail report often includes price and offer information. This lets you see whether competitors win with lower prices or stronger offers, giving you a qualitative context for the ranking data.
Add Search Catalog Performance When the Problem Looks Product-Specific
Search Catalog Performance helps you diagnose issues at the detail-page level. It aggregates search metrics for an individual ASIN. Use it when a product has weak performance across many queries.
Impressions
Catalog-level impressions show how often the ASIN surfaced across all relevant queries. A sudden drop could be an indexing or suppression issue that needs immediate attention.
Clicks
Catalog clicks reveal overall interest in the detail page from search. Weak clicks despite healthy impressions means your main image or title may be underperforming.
Cart Adds
Catalog cart adds measure purchase intent across all queries. Low rates point to a listing content problem, such as confusing bullets or missing key benefits.
Purchases
Catalog purchases show the final conversion. This is your bottom-line health indicator for a specific ASIN and helps you prioritize which product to improve first.
Treat Reverse ASIN Metrics as Competitive Evidence, Not First-Party Truth
Reverse ASIN tools provide estimates based on public search data and third-party modeling. They are not Amazon official reports, so treat them as directional, not authoritative.
Organic Rank
Organic rank is an estimate of where the ASIN appears in natural results for a keyword. It can change by marketplace, device, and search context. Use it to spot big differences, not tiny rank movements.
Sponsored Rank
Some tools show whether the ASIN is appearing in sponsored positions, such as top of search or product pages. This is useful for seeing if a competitor is buying ads on a keyword.
Estimated Search Volume
Third-party estimated search volume differs from Amazon query volume because it comes from external search trend data. Don't compare the two numbers directly; treat the third-party number as a relative popularity signal.
Estimated Traffic
Estimated traffic is a calculation based on rank and search volume. It gives you a rough sense of how much search traffic a competitor might be receiving. It is not a real measurement of their sales or impressions.
Build One Query-Level Dataset From Brand Analytics and Reverse ASIN
Now we can merge the datasets. Follow these six steps to create a single query-level analysis that ties your brand's funnel data to competitor visibility.
Step 1: Choose the Focal ASIN Before Choosing Competitors
Start with a single ASIN you want to grow. If you have several products, limit the analysis to one focal ASIN at a time; otherwise, the datasets become noisy. This ASIN should have meaningful traffic or sales data in Brand Analytics.
Step 2: Export the Brand Analytics Queries for That ASIN
Go to Amazon Brand Analytics > Search Query Performance, select the ASIN view, and export the report for the past 30–90 days. Filter for queries with at least a few impressions so you have enough signal. You'll get the search funnel metrics for your ASIN.
Step 3: Build a Competitor Cohort Around Search Overlap
Use the Query Detail report and your own market knowledge to pick 5-15 competitor ASINs that appear for the same queries. Group them into types.
Direct Substitutes
These are products that satisfy the same customer need and could replace yours. They likely share many keywords and are your primary competitive threats.
Search Result Leaders
These are ASINs that consistently appear in the top results for your key queries, even if their product is not a direct substitute. They define the bar for search-result quality.
Fast-Growing Challengers
Newer ASINs with rapidly rising rankings and reviews. They may not be top sellers yet, but they signal where search interest is moving.
Step 4: Run Reverse ASIN Across the Competitor Cohort
Use a reverse ASIN tool (like SellerSprite) for each competitor ASIN. Export the keywords that each competitor ranks for organically or appears for in sponsored positions. Set a minimum search volume filter if the tool provides it to avoid noise.
Step 5: Normalize the Keyword Lists Before Matching Them
The raw keyword lists will contain duplicates and minor variations. Normalize all terms before combining so that every concept appears as one row.
Singular and Plural Variations
Merge earbud and earbuds into one keyword family. Amazon may treat them similarly, but you want one row per conceptual query.
Word-Order Variations
wireless earbuds bluetooth and bluetooth wireless earbuds should be grouped. Normalize by sorting words alphabetically or using a keyword grouping tool.
Branded Queries
Decide whether to include competitor brand names. Branded keywords like Sony earbuds are usually irrelevant to your listing unless you intentionally target them, so separate them out or exclude them.
Duplicate Search Terms
Remove duplicate entries that come from multiple competitor ASINs. Keep a column showing how many competitors rank for each keyword.
Step 6: Create a Master Query Table
Combine your Brand Analytics export and the competitor keyword data into a single spreadsheet. Use one row per normalized query. The columns should include:
Amazon Query Volume
Pull from Brand Analytics if available, or from the reverse ASIN tool's estimated search volume when you have no first-party data.
Your Impressions, Clicks, Cart Adds, and Purchases
Copy these from the Brand Analytics export. These form the first-party funnel and give you proof of actual performance.
Your Organic Rank
Use a ranking tool or reverse ASIN to see your current organic position for the query. If you don't track this, note it as not visible.
Number of Competitors Ranking
Count how many competitor ASINs in your cohort rank for this query. This tells you competitive density.
Best Competitor Rank
The highest position achieved by any competitor ASIN. This gives a benchmark for how many positions you need to overcome.
Competitor Sponsored Presence
Note whether the competitors are appearing in sponsored placements. This indicates paid pressure and informs your ad strategy.
| Query | Amazon Query Volume | Impressions | Clicks | Cart Adds | Purchases | Competitors Ranking |
|---|---|---|---|---|---|---|
| wireless earbuds | 1.2M | 120K | 9K | 1.1K | 300 | 12 |
| bluetooth earbuds | 980K | 95K | 7K | 800 | 240 | 10 |
Use Three Signals to Judge a Keyword: Demand, Fit, and Competitive Visibility
You need more than search volume to decide whether a keyword is worth pursuing. Use three signals: demand, brand fit, and competitive visibility. Score each keyword on all three to make more objective choices.
Signal 1: Demand Comes From Amazon Search Behavior
Demand is best measured by Amazon's own query volume in Brand Analytics. If you have a small brand, you may not have data for every keyword, so supplement with reverse ASIN estimated search volume. But remember: third-party volume is an estimate, not Amazon's exact count.
Signal 2: Brand Fit Comes From the Search Funnel
Brand fit is about how well your product matches the search. Brand Analytics gives you behavioral fit. Look at these funnel gaps.
Impressions Without Clicks
If your product appears but shoppers don't click, your main image, title, price, or reviews aren't compelling enough for that query.
Clicks Without Cart Adds
Clicks but weak cart adds suggests the detail page doesn't match the search intent, or the product fails to answer the shopper's must-haves.
Cart Adds Without Purchases
Cart adds but low purchases usually points to price, availability, or checkout friction. This query may fit your product, but your offer needs improvement.
Signal 3: Competitive Visibility Comes From Reverse ASIN
Competitive visibility describes how hard it will be to win the keyword. Reverse ASIN tools help you answer three questions.
How Many Competitors Rank?
If dozens of ASINs rank for a keyword, that's a crowded result. If only a couple compete, you might have a clearer opportunity.
How High Do They Rank?
If most competitors are on page one, you'll need significant SEO or PPC effort. If they rank only on page two or three, a top-three position may be within reach.
Are They Organic, Sponsored, or Both?
A keyword where several ASINs use both organic and sponsored visibility is heavily contested. A keyword where most visibility is organic may respond better to SEO improvements.
Why Search Volume Alone Cannot Tell You Which Keyword Deserves Action
Search volume measures potential reach, not probability of winning. A high-volume keyword with low brand fit and strong competitors is a waste of effort. A low-volume keyword with strong fit and weak competition can generate profitable sales. The three-signal framework helps you prioritize actions that move the needle.
Turn the Combined Data Into a Four-Zone Keyword Opportunity Map
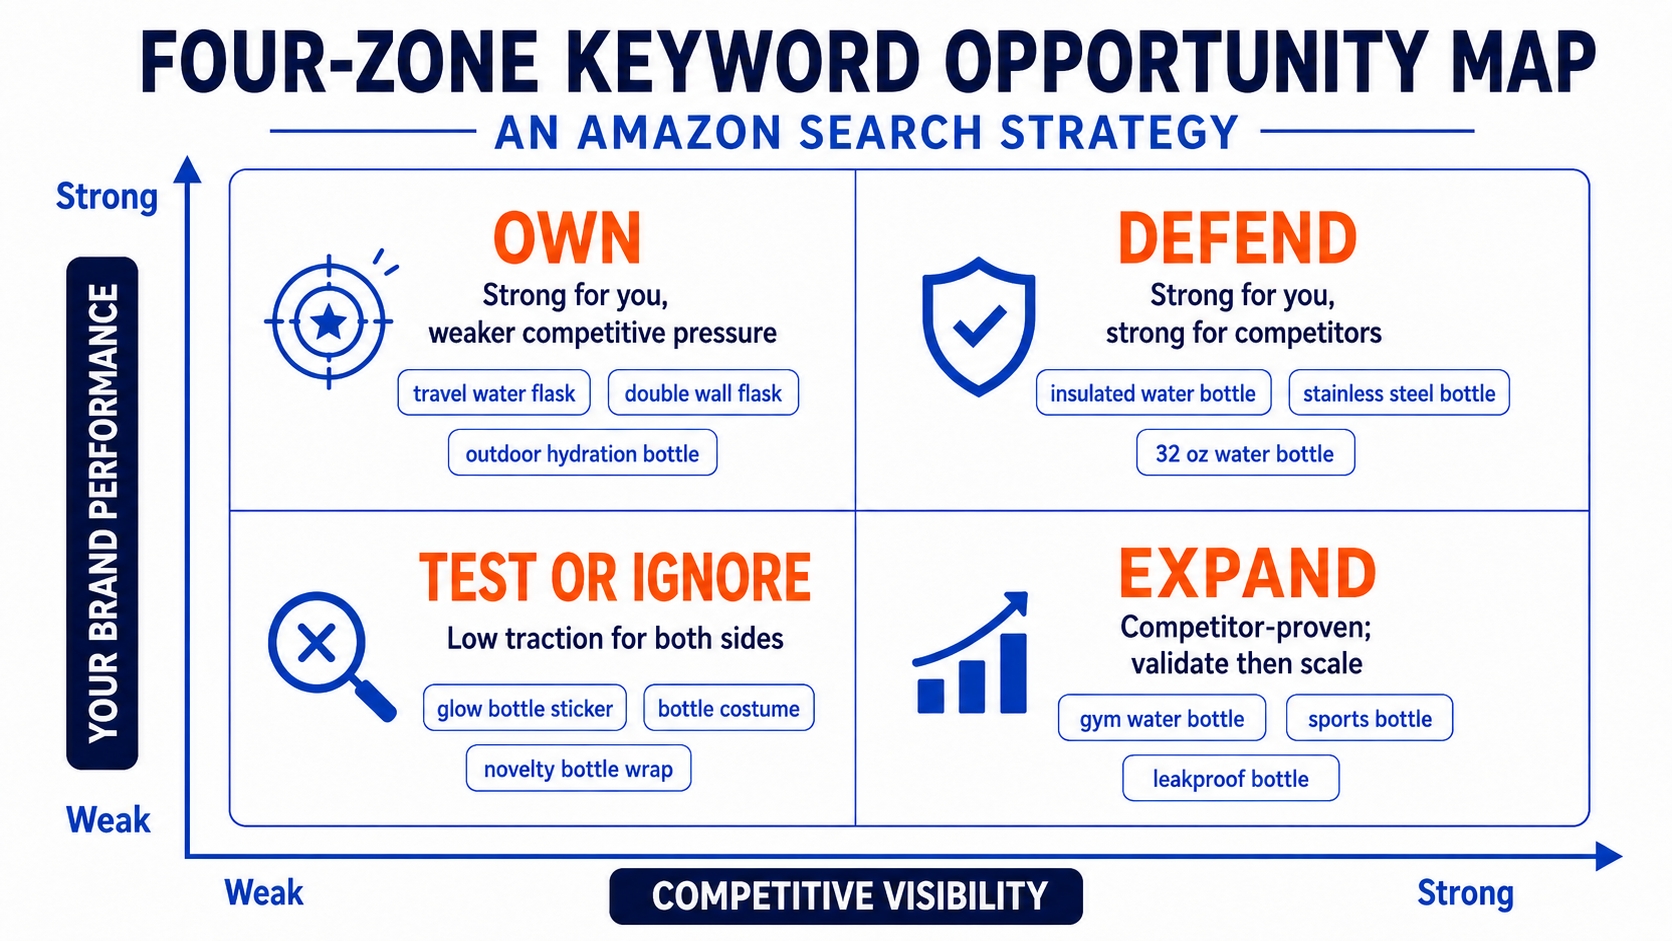
Take the three signals and place each keyword into one of four zones based on your brand performance and competitive visibility. This map tells you what action to take.
| Zone | Your Brand Performance | Competitive Visibility | Suggested Action |
|---|---|---|---|
| Zone 1 | Strong | Strong | Defend |
| Zone 2 | Weak | Strong | Expand (after validation) |
| Zone 3 | Strong | Weak | Own |
| Zone 4 | Weak | Weak | Test or Ignore |
Zone 1: Defend When Your Brand Performs and Competitors Are Strong
In Zone 1, your Brand Analytics shows good funnel performance for the query, but reverse ASIN shows many competitors ranking strongly. This is a core keyword you already win, so you need to defend it.
Protect Organic Rankings
Monitor your ranking weekly. Keep your listing optimized and maintain strong conversion to hold your position. A small dip can open the door for competitors.
Monitor Sponsored Pressure
Check if competitors are increasing sponsored bids on the query. If they are, you may need a targeted Sponsored Products campaign to protect the top-of-search position.
Avoid Unnecessary Listing Changes
For a keyword you already win, avoid major listing rewrites that could disturb your ranking. Only make changes when you see a measurable dip in performance.
Zone 2: Expand When Competitors Are Strong but Your Brand Is Weak
This zone shows weak first-party metrics but strong competitor visibility. It's a potential growth area, but you need to verify relevance first.
Check Whether the Query Is Relevant
Ask: does the search intent match your product? If not, you're chasing an incompatible audience that will never convert.
Identify the Keyword Coverage Gap
Compare your listing content and backend search terms with the term. If it's absent from your listing, that's the gap to close.
Decide Between SEO and PPC Validation
Start with a low-bid PPC campaign to test conversion. If it converts better than expected, invest in SEO by adding the phrase to your listing.
Zone 3: Own When Your Brand Performs but Competitor Coverage Is Weak
Here, your ASIN already gets good funnel metrics, but few competitors rank. This is an opportunity to widen the moat.
Consolidate Organic Authority
Make sure your listing clearly includes the keyword in title, bullets, and backend search terms, even if you already rank. Strong listing relevance keeps you there.
Look for Adjacent Long-Tail Queries
Use Keyword Mining to see what related keywords competitors haven't targeted yet. Add the most relevant long-tail variations to your listing to capture incremental search traffic.
Zone 4: Test or Ignore When Neither Dataset Shows Strong Evidence
Both your brand funnel and competitor visibility are weak for this keyword. It might be too new, too niche, or simply off-target.
Keep High-Relevance Queries on a Watchlist
If the query is highly relevant to your product but low-volume, keep it on a monthly watchlist. It might grow as shopper behavior changes.
Drop Keywords Supported Only by Search Volume
If high third-party search volume doesn't show up in Brand Analytics and no strong competitors rank, there's no evidence it converts on Amazon. Drop it and re-evaluate later.
Diagnose the Funnel Before You Change the Listing
The funnel metrics reveal where a keyword strategy breaks. Use these diagnostics to pinpoint the problem before making listing changes.
High Query Demand but Weak Brand Impressions
When Brand Analytics shows high query volume but your ASIN rarely appears in impressions, the fundamental issue is visibility.
Investigate Indexing and Organic Ranking
Run a reverse ASIN search on your own ASIN to see if you rank for the query at all. If not, you're not indexed. Check backend search terms and listing content to make sure you're relevant.
Check Whether Competitors Dominate the Query
Use Query Detail to see how many competitors are filling top positions. If there are already 10+, you need to either improve relevance or bid on the keyword to compete.
Strong Impressions but Weak Clicks
Shoppers see your product in search results but don't click. The problem is the search-result offer.
Investigate Ranking Position
If you're on page one but low (6th–10th), your main image and title may not stand out. Improve the main image value prop and test keywords in the title.
Compare Main Images and Offers
Look at the images of the competitors that get the most clicks. What symbol, angle, or badge do they use? Use that as inspiration without copying.
Check Price Positioning
If your price is significantly higher than competitors, search-result click-through drops. Evaluate whether a promotional launch price or coupon makes sense.
Strong Clicks but Weak Cart Adds
Shoppers are interested enough to click, but they don't add to cart. This indicates a mismatch between the search query and the detail page.
Investigate Search-Intent Mismatch
Sometimes a keyword sounds related but actually means something else. If running belt brings clicks from marathon runners but your belt is for casual walks, intent doesn't match.
Audit Product Messaging
Ensure the first few bullet points and product description answer the top questions shoppers have for that query. Highlight the specific benefit they searched for.
Compare Competitor Detail Pages
Check whether competitors offer better images, videos, or comparison charts. Make your page easier to scan and more compelling.
Strong Cart Adds but Weak Purchases
Shoppers add your product to the cart but don't complete the purchase. This is usually a conversion or offer system issue.
Investigate Price and Offer Friction
Is your price too high after shipping? Do competitors have coupons or Subscribe & Save discounts? Consider price adjustments or a limited-time coupon to close the gap.
Check Availability and Delivery
If your product shows a delivery estimate that's much longer than competitors, shoppers may abandon at cart. Ensure your FBA inventory is in stock and Prime eligible.
Compare the Competitive Offer Set
Look at what competitor listings offer: free gift bundles, extended warranties, or better ratings. These small differences can push a shopper to a competitor at the last second.
Use Reverse ASIN to Explain Changes You See in Brand Analytics
Reverse ASIN data is a powerful diagnostic layer when Brand Analytics changes unexpectedly. Use it to answer why behind a shift in search performance.
Your Query Volume Is Growing but Your Impressions Are Flat
Search demand is increasing, but your product isn't gaining more impressions. Something in the competitive landscape is changing.
Check Which Competitors Are Expanding Visibility
Run reverse ASIN on competitors that show up in Query Detail. Look for new keywords they've added or improvements in their organic ranks. If a competitor is suddenly ranking for the query, they're taking impression share.
Your Clicks Are Falling While Query Demand Remains Stable
Shoppers still search for the term, but fewer click on your product. This is a classic sign that competitive pressure has increased.
Look for Competitors Moving Into Higher Organic Positions
If a competitor's organic rank improved from page two to page one, they likely steal clicks from lower-ranked listings. Use reverse ASIN to monitor rank changes over time.
Check for Increased Sponsored Presence
If more competitors are running sponsored ads for the query, your organic result may be pushed down. Consider increasing your own ad bid or optimizing your listing to compensate.
A High-Purchase Query Has Weak Visibility for Your ASIN
Brand Analytics shows the query converts well, but your ASIN doesn't appear in the report. This is a clear gap worth attacking.
Identify the Competitors Capturing That Query
Query Detail shows the top ASINs. Use reverse ASIN on those ASINs to see which keywords drive their visibility.
Compare Their Keyword Coverage With Yours
Check whether competitors include the exact phrase in title, bullets, or backend. If they do but you don't, add it to your listing.
Reverse ASIN Finds a New Keyword Cluster That Brand Analytics Does Not Show Yet
Reverse ASIN surfaces a group of keywords competitors rank for that don't appear in your Brand Analytics report yet. This might mean you haven't been indexed or you haven't accumulated enough traffic.
Treat It as a Discovery Signal, Not Proof
Third-party tools estimate demand and rankings; they don't prove Amazon query volume. Use them to build a hypothesis.
Validate Relevance Before Changing the Listing
Only add the phrase to your listing if it clearly matches your product. Then watch Brand Analytics after a few weeks to see if Amazon starts reporting impressions and clicks for it.
The Keyword Graduation Loop: From Competitor Clue to First-Party Proof
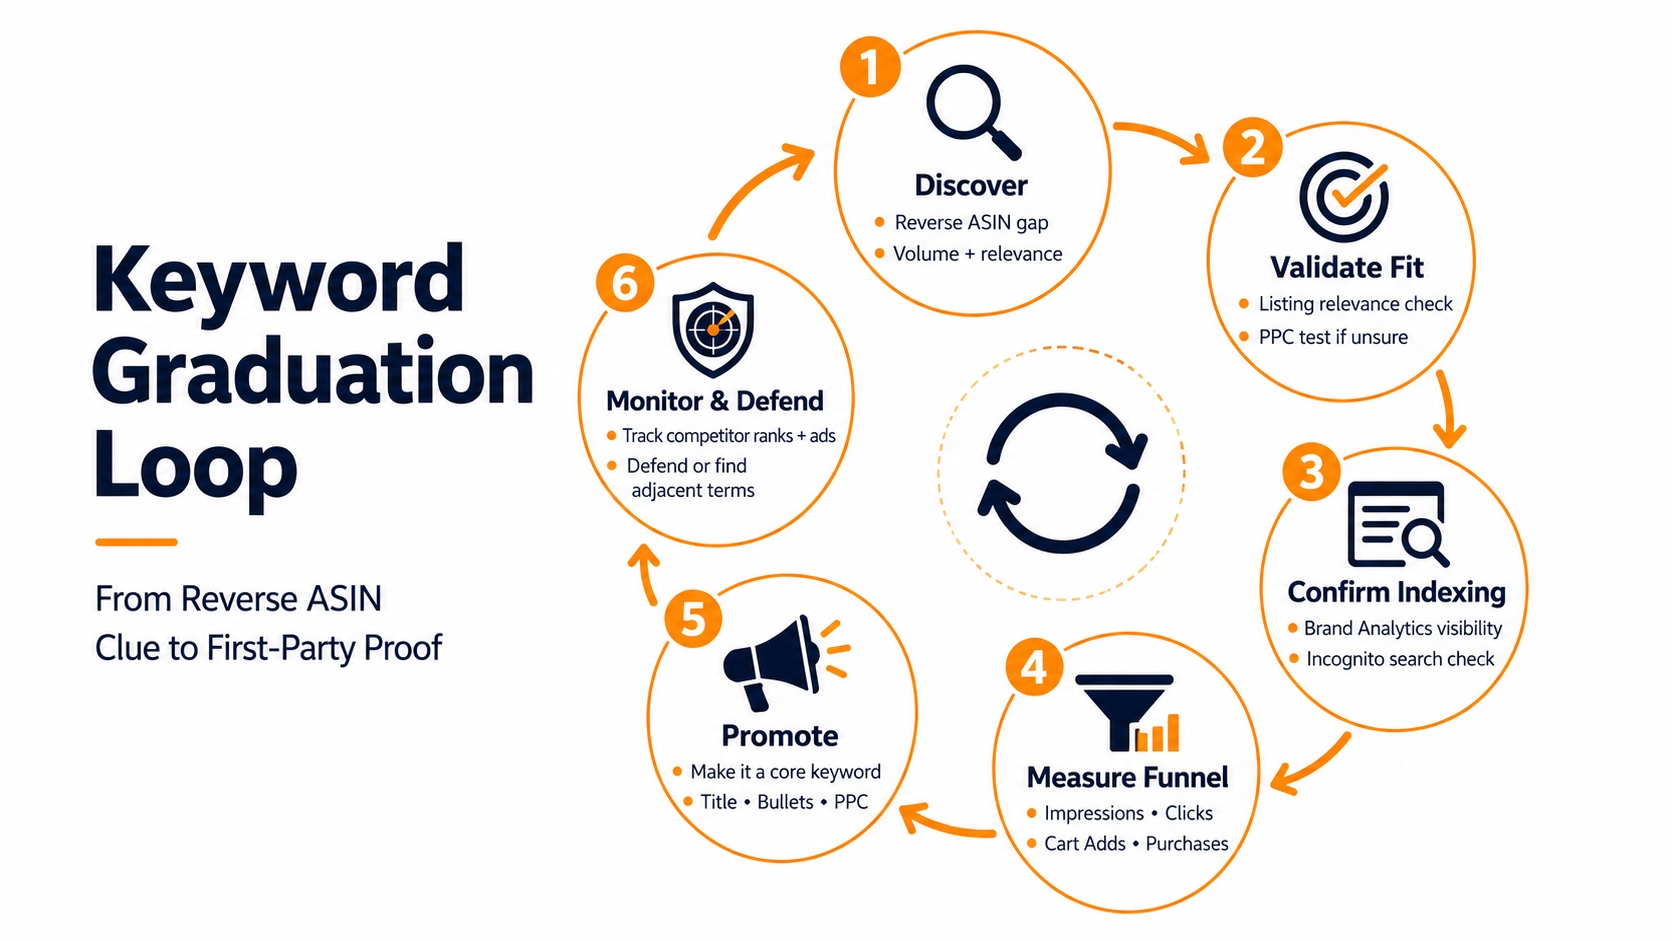
Not every keyword from reverse ASIN deserves listing changes. Use a six-stage loop to promote a keyword from a competitor clue to a first-party validated keyword.
Stage 1: Discover the Query Through Reverse ASIN
Identify a query that competitors rank for but you don't. Record its estimated volume and relevance to your product.
Stage 2: Validate Product Relevance
Before doing anything, confirm the query matches your product's use case and language.
Listing Relevance Check
Does your product serve the need implied by the query? If yes, is the phrase naturally found in your listing title or bullets? If not, add it.
PPC Validation When Intent Is Uncertain
If you can't tell whether the query is a good fit, launch a small Sponsored Products campaign targeting only that query. Monitor clicks and conversions over two weeks.
Stage 3: Watch for the Query to Enter Your Brand Analytics Data
Once the query is in your listing, Amazon needs to index your ASIN for it. You may see impressions in Brand Analytics within a few weeks. If the query still doesn't appear, use manual search in incognito mode to verify indexing.
Stage 4: Measure Its Search Funnel Performance
Now use first-party funnel metrics to evaluate whether the keyword is worth promoting. Track:
Impressions
You now have visibility. Is it growing week over week? If it's tiny, the query may be too niche.
Clicks
What's your click-through rate? This tells you whether shoppers find the product appealing for that search.
Cart Adds
Are people adding to cart? If yes, the keyword is a good behavioral fit.
Purchases
At least one conversion is the green light. A purchase is the strongest first-party proof.
Stage 5: Promote the Query From Experiment to Core Keyword
If the query shows a decent funnel (clicks, cart adds, purchases), promote it to a core keyword. Add it prominently to the title, bullets, or backend search terms if you haven't already. Include it in your organic ranking monitoring and consider a dedicated PPC campaign to accelerate growth.
Stage 6: Monitor Whether Competitors Start Taking Visibility Back
Once you start ranking, competitors may respond with listing changes or higher ad bids. Use Product Tracker to track their ranks and sponsored presence for the query. If competitive pressure increases, shift your strategy from growth to defense or find adjacent variations.
Decide What to Do With Each Validated Keyword
After validation, match each keyword to an action. Not all validated keywords go into the title.
Move High-Demand, High-Fit Keywords Into Listing SEO
If a keyword has solid demand, clear brand fit, and a manageable competitor set, optimize your listing for it.
Title
Place the primary keyword phrase naturally in the title while keeping the title readable.
Bullet Points
Weave the keyword phrase into a descriptive bullet point, ideally one that addresses a key benefit or feature. Don't keyword-stuff; write for shoppers.
Backend Search Terms
Add the exact phrase and common variations to the backend search terms field if you haven't used them in the visible listing. Use lowercase and avoid spaces between synonyms if possible since Amazon's indexing handles them differently.
Use PPC to Validate Keywords With Uncertain Buyer Intent
When a keyword is relevant but you aren't sure if shoppers will buy, run a low-bid Sponsored Products campaign with a tight budget. Monitor clicks, conversion rate, and ACoS for 1-2 weeks. If it converts profitably, consider moving it into listing SEO. If not, keep it as a long-tail PPC term or pause it.
Defend Queries Where Competitors Are Increasing Paid Visibility
If reverse ASIN shows more competitors advertising on a keyword you already win, maintain or increase your sponsored bid to protect your position. Also keep your organic listing optimized so you don't over-rely on paid clicks.
Leave High-Volume but Low-Fit Keywords Alone
Search volume can be seductive, but if the keyword's intent doesn't match your product, adding it to your listing will attract confused clicks and hurt conversion. Leave it out of your SEO and PPC unless you have a specific product variation for that search.
Turn Repeated Query Gaps Into Product-Positioning Insights
When you see the same competitor keywords missing from your catalog across multiple products, you may have an opportunity to expand your product line or reposition an existing product.
Missing Features
If competitors rank for with microphone and your product doesn't have a microphone, that's a product development signal.
New Use Cases
If competitors win for outdoor running and you can adapt or bundle for that setting, consider a new variant.
Emerging Customer Language
New terms or brand-specific acronyms can reveal how customer language is shifting. Use these insights to update your listing or develop content.
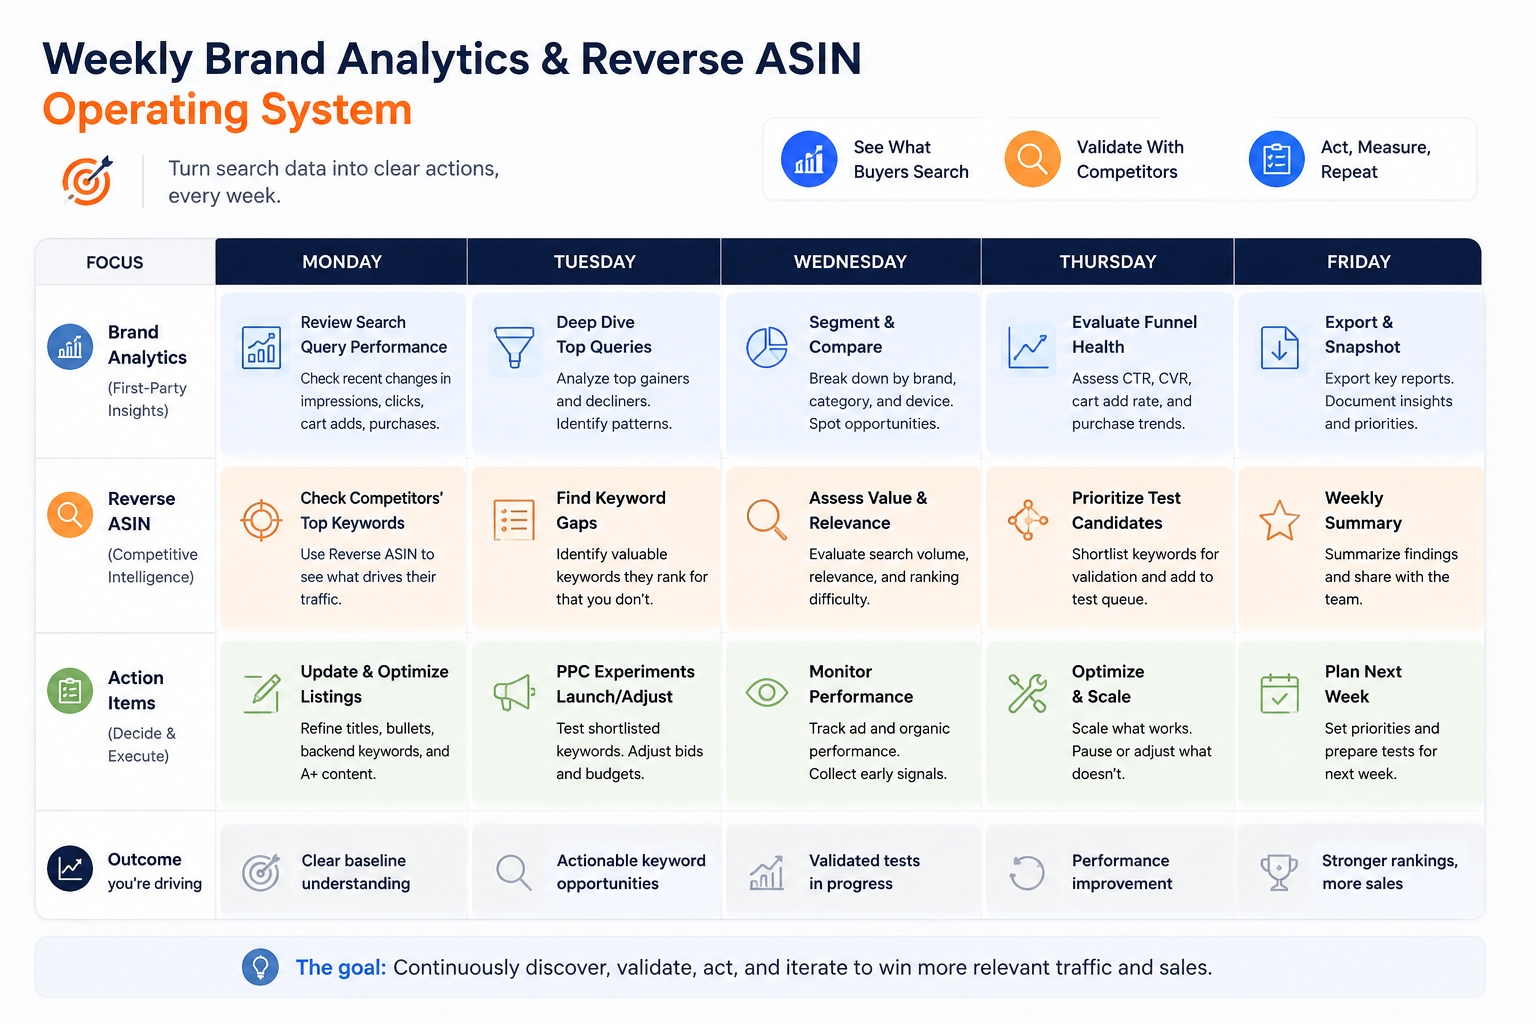
Build a Weekly Brand Analytics + Reverse ASIN Operating System
Consistency is more important than one-time analysis. Set up a weekly routine to keep your keyword strategy current.
Start With Brand Analytics, Not Reverse ASIN
Your first-party data should drive which questions you ask the reverse ASIN tool. Start with the Brand Analytics reports for your main ASINs and identify unusual changes or growth opportunities.
Flag Queries With Meaningful Funnel Changes
You don't need to track every query. Flag the ones where the funnel changes significantly week over week.
Demand Change
Query volume rises or falls by more than 20-30% for a keyword you care about.
Impression Change
Your impressions jump up or down for a query, indicating a ranking or indexing shift.
Click Change
Clicks decline despite steady impressions, suggesting your search-result offer is losing appeal.
Purchase Change
Purchases change even when clicks are stable, revealing conversion issues.
Use Reverse ASIN Only on Queries or ASINs That Need Explanation
Instead of running reverse ASIN on everything, use it on a few competitor ASINs or a flagged query. This keeps your workflow fast and avoids analysis paralysis.
Assign Every Flagged Query an Action
Create a simple task column in your tracker for each flagged query.
Defend
Maintain ranking and monitor competitors.
Expand
Improve listing content to win more visibility.
Validate
Run PPC test before making SEO changes.
Monitor
Watch trends for another week before acting.
Ignore
Not relevant or too low priority to action.
Refresh the Competitor Keyword Universe Periodically
The search landscape changes constantly. Every 4-6 weeks, run reverse ASIN on your top 5-10 competitors again to uncover new keyword clusters they've entered. Add those to your master query table and re-score them.
Five Data Mistakes That Can Break the Combined Analysis
Avoid these common pitfalls when merging Brand Analytics and reverse ASIN data.
Treating Amazon Query Volume and Third-Party Search Volume as the Same Metric
Amazon query volume is an exact count of shopper searches within Amazon for the period. Third-party volume is modeled from external search data. They can differ wildly. Never compare them side by side on the same axis; use one or the other to make a relative ranking.
Assuming a Missing Brand Analytics Query Has No Demand
If your ASIN doesn't get impressions for a query, the query won't appear in your Brand Analytics report. That doesn't mean there is no demand. It may mean you're not indexed for the query. Use the competitor reverse ASIN data to find keywords you're missing and test them.
Treating Competitor Rank as Proof of Competitor Sales
A competitor ranking at position #1 for a keyword doesn't guarantee they're making lots of sales. Top position can generate visits, but conversion depends on reviews, price, and listing quality. Use rank as a competitive signal, not a sales forecast.
Mixing Organic and Sponsored Visibility Into One Ranking Metric
Organic rank and sponsored placement are different. Some tools show a combined winning position, which can make a competitor look stronger organically than they actually are. Always separate organic and sponsored columns in your analysis.
Comparing Metrics Across Dashboards Without Checking Their Definitions
Search volume in a reverse ASIN tool can mean one thing, while query volume in Brand Analytics means another. Impressions may also be defined differently in PPC dashboards. Before you merge, write down the exact definition and data range for every metric.
What Brand Analytics Can Prove and What Reverse ASIN Can Only Suggest
Knowing the limits of each dataset prevents you from making incorrect assumptions and decisions.
Brand Analytics Can Provide First-Party Search Funnel Evidence
Brand Analytics is official Amazon data for your brand. It proves how many queries, impressions, clicks, cart adds, and purchases your ASIN received for a search term. It's the closest you can get to ground truth about your search performance.
Reverse ASIN Can Reveal Competitive Visibility Patterns
Reverse ASIN can show you which keywords competitors appear for and their approximate organic or sponsored rank. It's a composite of public search result data and modeling. It reveals patterns, but not official metrics.
Neither Tool Can Tell You a Competitor's Exact Conversion Rate or Ad Budget
Competitive conversion rates and spend are private. Reverse ASIN may estimate traffic or sponsored presence, but it can't see a competitor's advertising dashboard. Don't try to infer their exact profit or ROI.
Correlation Across Both Datasets Is Still Not Causation
If you see both your brand's high purchase count and competitors' high rank for a keyword, that doesn't mean the keyword causes sales. It may correlate with demand for the whole category. Use controlled experiments (like PPC) to test causality.
Use the Combination to Improve Decisions, Not to Pretend You Know Competitor Internals
The goal is to make better choices about where to invest your time and ad budget rather than to claim you know your competitor's entire strategy. Use the combined data to form hypotheses, then validate with your own first-party data.
A Practical Decision Framework for Common Amazon Search Scenarios
To make this actionable, here are six common scenarios and the recommended first move.
Scenario 1: Competitors Rank, You Do Not, and Amazon Shows Strong Demand
Brand Analytics for a related ASIN shows high query volume; reverse ASIN shows many competitors ranking for the query, but your focal ASIN doesn't appear in Brand Analytics. This is a classic keyword expansion opportunity.
Priority: Expand
Start with a PPC campaign to test relevance. If conversions are promising, add the keyword to your listing SEO.
Scenario 2: You Rank, Get Impressions, but Shoppers Do Not Click
High impressions, low clicks. The search-result offer is weak.
Priority: Improve the Search Result Offer
Optimize the main image, title, price, and review display. Test a new main image and A/B test the title if possible.
Scenario 3: You Get Clicks but Competitors Win More Purchases
You get good clicks but below-average conversion. Competitors appear to convert better.
Priority: Fix Conversion Before Expanding Keywords
Improve the detail page content, add comparison with competitors, and check price competitiveness. Once conversion is healthy, expand to more keywords.
Scenario 4: Reverse ASIN Finds a Keyword That Brand Analytics Does Not Yet Surface
A reverse ASIN search reveals a relevant keyword that your ASIN doesn't appear for, and you have no first-party funnel data for it.
Priority: Validate
Check relevance, add the keyword to backend search terms if appropriate, and monitor Brand Analytics for new impressions. Use PPC to speed up validation.
Scenario 5: You Already Win the Query but Competitors Are Increasing Sponsored Visibility
Brand Analytics shows good purchases, but reverse ASIN shows more competitors using sponsored ads for the query.
Priority: Defend Selectively
Increase your sponsored bid to protect top-of-search, but keep an eye on ACoS. Also, strengthen your listing so you can win organically even without the ad.
Scenario 6: Search Demand Falls for Everyone
Brand Analytics shows query volume declining across the board, and reverse ASIN shows competitors' rankings also weaker. This is a category or seasonal shift.
Priority: Reallocate Rather Than Optimize Harder
Move resources to adjacent keywords that are still growing, rather than fighting for a shrinking query.
FAQ
Can I use Amazon Brand Analytics without brand registry?
No. Amazon Brand Analytics is available only to sellers who are brand-registered through Amazon Brand Registry and have a Professional selling plan. If you don't have it, you can still use reverse ASIN tools to get competitive data and later upgrade to Brand Analytics as you grow.
What is the difference between Search Query Performance and Search Catalog Performance?
Search Query Performance (SQP) gives you search-term-level data like how many queries, impressions, clicks, cart adds, and purchases for individual search terms. Search Catalog Performance (SCP) gives you ASIN-level data that aggregates the same funnel metrics for a single product. Use SQP to find keywords, and use SCP to diagnose product-specific issues.
How often does Amazon Brand Analytics data update?
Most Brand Analytics reports update weekly. Search Query Performance and Search Catalog Performance data are typically refreshed weekly, though some metrics can update on a daily basis in certain views. Always check the data range in the report before comparing metrics with reverse ASIN data.
Is reverse ASIN data accurate?
Reverse ASIN data is an estimate based on public search results and third-party modeling. It's not official Amazon data. It is highly useful for spotting competitive patterns, but you should always validate with your own Brand Analytics data or PPC tests before making major listing changes.
How many competitor ASINs should I include in a reverse ASIN analysis?
Start with 5-15 ASINs that appear in your Query Detail report or are direct substitutes. Include a mix of direct substitutes, search result leaders, and fast-growing challengers. More than 15 usually creates diminishing returns and slows down your analysis.
Next Steps
- Start by exporting your Brand Analytics Search Query Performance report for your main ASIN.
- Choose 5-10 competitor ASINs and run them through SellerSprite's Keyword Reverse tool.
- Build your master query table, score each keyword with demand, fit, and competitive visibility, and place them into the four-zone map.
- Prioritize one keyword from Zone 2 or Zone 4 and run a small PPC validation campaign.
- Sign up for SellerSprite to start using reverse ASIN search and turn competitor data into growth.
References
- Amazon Advertising: Amazon Search Query Performance View
- Amazon Advertising: Search Catalog Performance View
- SellerSprite: Reverse ASIN Strategy Guide View
- SellerSprite: How to Perform a Reverse ASIN Search View
- SellerSprite: Amazon Brand Analytics Search Terms Guide View
By SellerSprite Success Team
The SellerSprite Success Team combines deep Amazon marketplace expertise with data science to help sellers grow profitably. With years of experience in e-commerce analytics, we focus on ethical, sustainable strategies that align with Amazon's evolving algorithms and policies. Our insights are trusted by thousands of sellers worldwide.
Last updated: 2026-08-27