TL;DR: ChatGPT Code Interpreter (now marketed as Advanced Data Analysis) can turn a raw Amazon sales export into a cleaned KPI table, trend charts, and a forecast range inside one chat — if you prepare the file correctly and verify the math. This guide walks US sellers through the exact file prep, a seven-step analysis workflow, copy-and-paste prompts, and the guardrails that keep AI output decision-grade.
Key Takeaways
- Code Interpreter runs real Python in a sandbox: attach a CSV or Excel export and ChatGPT cleans it, calculates metrics, draws charts, and hands back downloadable files — no coding required from you.
- Output quality is decided before you type a prompt: one header row, a true date column, numeric fields stripped of currency symbols, one row per ASIN per day, and zero buyer PII.
- It is strongest at first-pass analysis — KPI baselines, week-over-week decomposition, outlier detection, seasonality views, and scenario forecasts — and weakest at anything requiring live marketplace data or verified category benchmarks.
- Always request a data-quality audit, the underlying code, and a backtest error figure, then tie totals back to Seller Central before you change a price, a bid, or a purchase order.
- Pair one-off file analysis with a marketplace intelligence tool such as SellerSprite when you need keyword demand, competitor tracking, and refreshed data instead of a single frozen snapshot.
Table of Contents
- What ChatGPT Code Interpreter Actually Is
- Why Sellers Use It for Sales Data Analysis
- Step 1: Prepare and Export Your Amazon Sales Data
- Step 2: Run the Analysis (7-Step Walkthrough)
- Copy-and-Paste Prompts That Work
- Forecasting Without Over-Trusting the Numbers
- Turning Tables into Charts and Mini Dashboards
- Accuracy, Privacy, and Guardrails
- Where ChatGPT Stops and SellerSprite Starts
- A Repeatable Weekly and Monthly Routine
- Common Mistakes That Wreck AI Sales Analysis
- FAQ
- References
Note on marketplaces: This guide is specifically optimized for the US market. Report names, menu labels, plan availability, and data controls reflect what Amazon.com sellers and US-based ChatGPT users typically see today; both platforms change their interfaces frequently, so confirm the current labels inside your own accounts before you build a routine around them.
What ChatGPT Code Interpreter Actually Is
Code Interpreter is the part of ChatGPT that gives the model a temporary, sandboxed Python environment. When you attach a CSV or Excel file, ChatGPT can open it, write code to clean and reshape it, execute that code, read the result, and return tables, charts, and downloadable output files. OpenAI has since rebranded the capability as Advanced Data Analysis and lists it as data analysis in the model picker, but the older name stuck — most sellers, operators, and guides still call it Code Interpreter.
Three practical consequences follow. First, you do not need to write Python yourself; you describe the outcome in plain English and review what comes back. Second, the analysis is iterative — you can challenge a result, ask for a different cut, or tell the model to fix a mislabeled column without starting over. Third, the work is reproducible, because you can ask for the script and re-run the identical transformation next month on a fresh export.
It is equally important to be clear about what it is not. It has no connection to Seller Central, so it does not pull live data and cannot see today's orders. It does not know your category's conversion benchmarks, your competitor's price history, or your supplier's lead time unless you put those numbers in the file or the prompt. The working file lives only inside that conversation, so every new session starts with a fresh upload. And access to data analysis depends on your ChatGPT plan — availability and file-size limits change, so verify the current terms on OpenAI's site before you promise a workflow to your team.
The Amazon files it handles best are the same ones that overflow a spreadsheet: Business Reports exports (Detail Page Sales and Traffic by ASIN), Sponsored Products search term and campaign reports, restock and FBA inventory reports, returns reports, settlement summaries, and your own cost-of-goods sheet. Those six files, combined well, answer most of the questions a growing seller actually asks each week.
Why Sellers Use It for Sales Data Analysis
The honest reason ChatGPT Code Interpreter sales analysis took off is speed of the first pass. Building a twelve-month KPI table by ASIN, splitting a revenue drop into price versus volume versus traffic, and spotting which three SKUs caused a bad month is normally thirty to ninety minutes of pivot-table work. A well-posed prompt gets you a draft in a couple of minutes, and you spend your time checking rather than assembling.
There are four more reasons it fits e-commerce operations. It tolerates messy exports, which is what Seller Central produces. It removes the tooling barrier for small teams that will never buy a BI license. It standardizes analysis across people: the same prompt run on the same report structure produces the same table whether a beginner seller or a brand analyst runs it. And it doubles as a teaching tool, because you can ask why a number moved and get the calculation, not just the number.
Where the approach breaks down is worth stating just as plainly. It cannot tell you that a keyword gained search volume last week, that a competitor dropped their price, or that a new entrant took the buy box — that information is not in your file. It cannot refresh a dashboard on a schedule. And for thin data — a launch ASIN with three weeks of history and forty orders — any model it fits is closer to a guess than a forecast. Treat it as a fast, tireless analyst assistant that only knows what you hand it.
Step 1: Prepare and Export Your Amazon Sales Data
This is the section most guides skip, and it is the one that determines whether your analysis is useful or embarrassing. ChatGPT will faithfully analyze a badly built file and produce a confident, wrong answer. Spend fifteen minutes here and save an hour of debugging later.
Which reports to pull
- Business Reports → By ASIN → Detail Page Sales and Traffic by Child Item. Pull daily data for at least twelve months. This gives units ordered, ordered product sales, sessions, page views, buy box percentage, and conversion — the backbone of the analysis.
- Sponsored Products search term report and campaign report. Needed for ad efficiency, wasted spend, and the true cost of each sale.
- FBA inventory, restock report, or inventory ledger. Inventory position, inbound quantity, and days of supply by SKU.
- Returns report. Returned units and reason codes, which explain part of the gap between ordered and net units.
- Your own COGS and fee sheet. Unit cost, referral fee, FBA fulfillment fee, inbound freight. Without it you can analyze revenue but not profit.
Cleaning rules to apply before upload
- One header row only. Delete title rows, merged cells, blank rows, and the report-generated-on footer Amazon appends.
- A real date column in YYYY-MM-DD. Text labels such as Week 1 or a month name will be interpreted as categories, not time.
- Numbers must be numbers. Strip currency symbols, thousands separators, and percent signs, or convert percents to decimals. Otherwise every sum will silently fail.
- One grain per file. One row per ASIN per day. Never mix daily and monthly rows in the same sheet.
- Consistent keys. The same ASIN and SKU format everywhere, no leading apostrophes, no trailing spaces, no renamed variants mid-year.
- Save as CSV UTF-8 for a single table, or XLSX with clearly named tabs when you need several.
- Strip buyer PII. No names, addresses, emails, phone numbers, or individual order IDs. None of that helps the analysis and all of it adds risk.
- Add a data dictionary tab. Column name, plain-English definition, and which report it came from. It takes five minutes and prevents half of all misunderstandings.
| File | Grain | Questions it answers |
|---|---|---|
| Detail Page Sales and Traffic | ASIN × day | Is the problem traffic or conversion? Which SKU carried the month? |
| Search Term Report | Term × campaign × day | Where is ad spend leaking? Which terms actually convert? |
| Restock / Inventory | SKU × day | When will this SKU stock out? How much can I safely reorder? |
| COGS sheet | SKU | What margin do I actually earn after fees and freight? |
One sizing note: very large daily exports can exceed what a single chat session handles comfortably. If your file is heavy, aggregate to weekly grain first, or split by report type, and keep a weekly version for trend work and a daily version only for the specific month you are investigating.
Step 2: Run the Analysis (7-Step Walkthrough)
Work through these seven steps in order. Each one builds on the last, and each produces something you can check. The prompts below are written for Amazon sellers but work for any sales dataset with a date, a product key, units, revenue, and traffic.
Step 1 — Upload the file and confirm the schema
This step catches the single most common failure: ChatGPT interpreting the header row as data, or reading a text date as a category. If the column list does not match your file, stop and re-export.
Step 2 — Run a data-quality audit
Stockouts are the classic distortion. A SKU that ran out for nine days shows a revenue crash that is not a demand problem, and if you forecast from that history you will under-order next quarter. The audit tells you which gaps to fix or annotate before modeling.
Step 3 — Build the KPI baseline
Check two numbers against Seller Central before you trust anything downstream: total units and total ordered product sales for one complete month. If they reconcile, the parsing is sound. If they do not, the file has a grain problem.
Step 4 — Decompose the change
This is the step that earns its keep. Instead of a vague story about the month being slow, you get a ranked list: three ASINs explain most of the decline, two of them lost sessions, one lost conversion, and price contributed almost nothing. That is an action list, not a narrative.
Step 5 — Find patterns, outliers, and structural breaks
You then annotate those dates yourself from memory or your promo calendar: Prime Day, a deal event, a listing suppression, a competitor stockout, a price change. The model finds the shape; you supply the meaning.
Step 6 — Forecast with ranges, not single numbers
A forecast without a backtest is decoration. The backtest turns it into something you can weigh against your own judgment, and the scenario range is what you actually plug into a purchase order discussion.
Step 7 — Convert findings into actions and exports
Save the script in the same folder as your report exports, named by report type and month. Next month you attach the new file, paste the script, and skip straight to reviewing results.
Copy-and-Paste Prompts That Work
The difference between a vague answer and a useful one is almost always specificity: name the metric, the period, the comparison, and the output format. These six prompts cover most recurring sales questions. Adapt the numbers, keep the structure.
- Margin reality check: Using the COGS sheet and the sales table, calculate contribution margin per unit and per month after referral fee, FBA fee, and inbound freight. Rank SKUs by total margin dollars, not by revenue, and show which SKUs look strong on revenue but weak on margin.
- Price and volume split: If I raise price by 8 percent on this ASIN, model the unit impact at elasticity assumptions of -0.5, -1.5, and -2.5 using the last 12 months of price and units. Show revenue and gross margin for each scenario and state which assumption you consider most realistic and why.
- Restock planner: Using average daily units over the last 28 and 90 days, a supplier lead time of 45 days, and a safety stock of 21 days, calculate the reorder date for each SKU and flag every SKU that will stock out within 60 days. Show the calculation column by column.
- Ad waste finder: From the search term report, list terms with spend above 20 dollars and zero orders, and separately terms with at least three orders and ACOS below my target of 25 percent. Group both lists by campaign and match type, and estimate monthly savings if the waste terms were negated.
- Seasonality check: Compare this year to last year by month for each ASIN and tell me whether the seasonal shape is consistent or shifting. Flag any ASIN whose peak month moved by more than two weeks.
- Executive summary: Write a 150-word summary of this month for a founder who has not seen the data: what grew, what declined, the single biggest driver of each, and the three decisions that need to be made this week. No jargon, no hedging.
Two habits make any prompt better. Ask for the output format explicitly — table, chart, or workbook tab — because you will reuse it. And end with a verification instruction, such as: state the row count you analyzed and any rows you excluded, so the numbers can be audited later.
Forecasting Without Over-Trusting the Numbers
ChatGPT for sales forecasting is genuinely useful, provided you understand what is being produced. The model fits a statistical routine — exponential smoothing such as Holt-Winters, a seasonal regression, or a simple decomposition — to your history. That is arithmetic on the past, not foresight. It cannot know that a competitor is launching a cheaper variant next month or that your supplier is raising prices in Q3.
Three things reliably damage forecast accuracy in Amazon data. First, stockouts censor demand: the units you did not sell because you had nothing to ship disappear from the history and drag the forecast down. Second, promotional events create spikes that a seasonal model may wrongly learn as recurring. Third, structural change — a new variation, a merged listing, a buy box loss, a price step — moves the baseline so the old history is no longer representative. Before you trust a forecast, tell the model about every one of these events and ask it to exclude or annotate those periods.
The backtest is your main defense. Ask for the error as a percentage of actual units over a held-out period. As a working rule of thumb rather than a published benchmark, a stable ASIN with clean history often lands in a range where weekly error sits in the mid-teens or better, while a volatile or thin-history ASIN can easily exceed 30 percent. When the error is high, stop using the point estimate and plan against the high and low scenarios instead.
Finally, never let a forecast become a purchase order without a human in the loop. The value of the exercise is that you arrive at the buying meeting with a defensible range, a documented set of assumptions, and a clear statement of what would have to be true for the optimistic case to happen. That is a stronger position than a single guessed number in a spreadsheet cell.
Turning Tables into Charts and Mini Dashboards
Visualization is where Code Interpreter feels almost unfair. A single prompt can produce publication-ready charts from a file that would have taken an afternoon in Excel, and you can request a specific style, size, and labeling convention. Ask for a 1200 by 600 pixel PNG with readable axis labels and no chartjunk, and you usually get something you can drop into a deck.
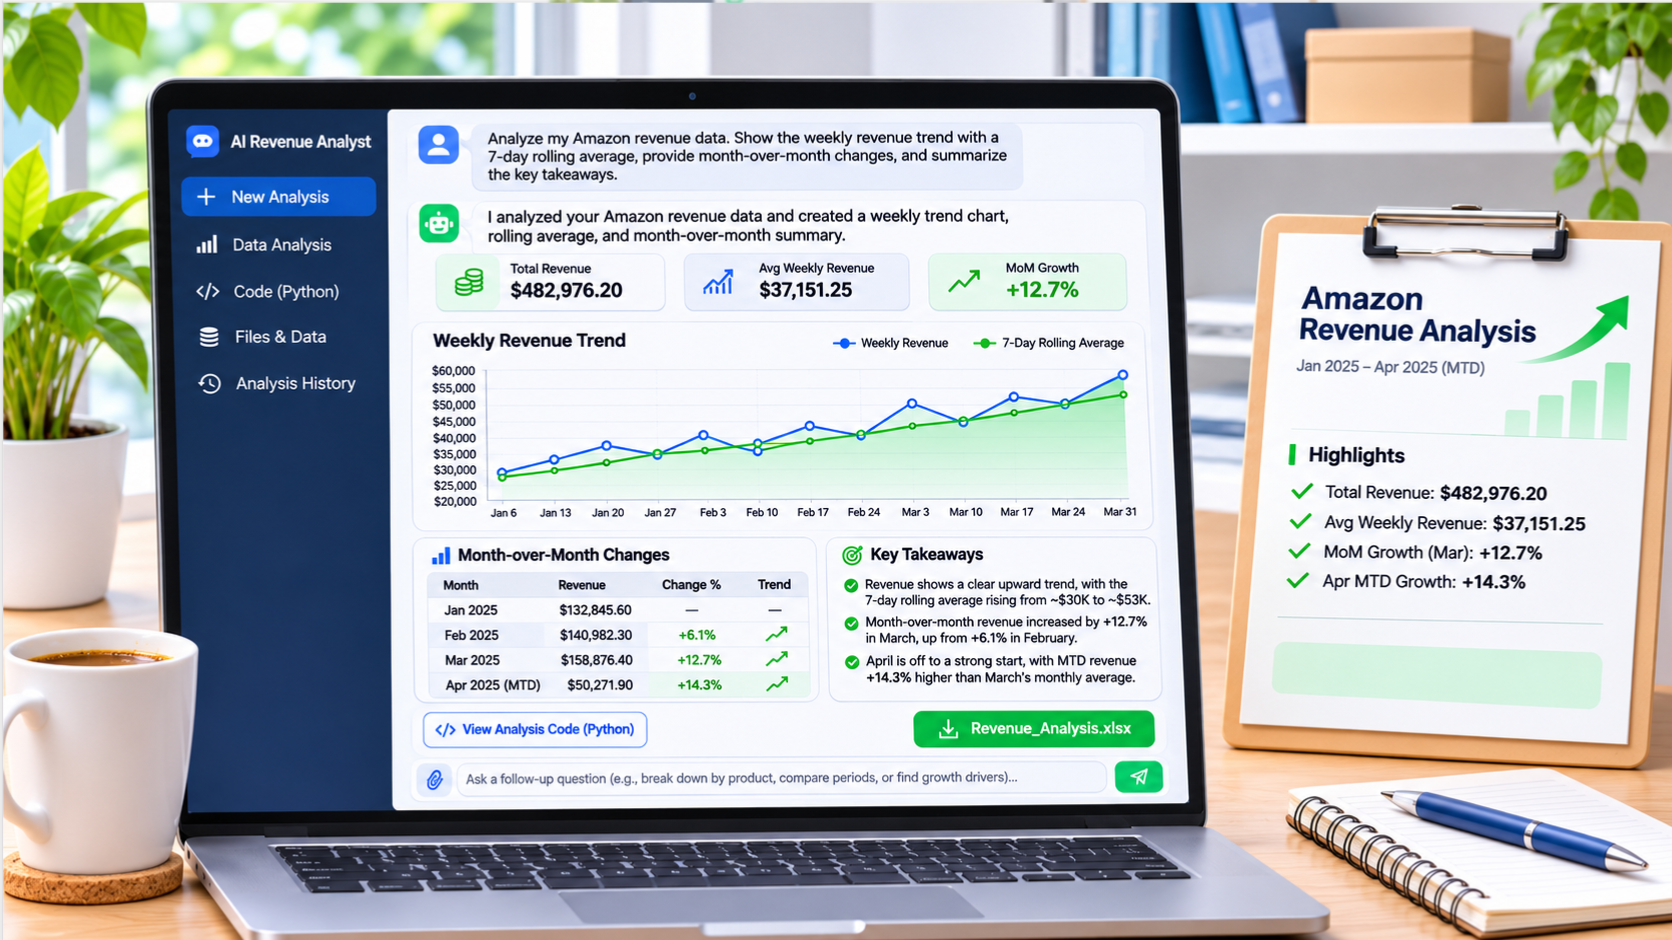
Five charts cover most seller needs. A revenue line with a 7-day rolling average separates signal from daily noise. A dual view of sessions and conversion shows whether a slowdown is a traffic problem or a listing problem. A stacked bar of ASIN contribution reveals concentration risk in a single glance. A price-versus-units scatter shows whether demand responds to your pricing at all. And a forecast fan chart communicates uncertainty honestly to whoever approves the budget.
The limitation is persistence. Charts generated in a chat are static images with no refresh, no filters, and no scheduled delivery. If you need a dashboard that updates every morning, export the cleaned table as CSV, load it into a spreadsheet or a free BI layer, and keep the chat for the ad-hoc questions that do not fit a fixed layout. Many teams run exactly that split: a lightweight refreshable dashboard for monitoring, and a chat session for the deep dive when a number looks wrong.
Accuracy, Privacy, and Guardrails
An AI that produces a clean table with a confident tone is persuasive whether or not it is right. Build these checks into your routine and the risk drops sharply.
- Reconcile one period by hand. Sum units and sales for a single complete month in the file and compare to Seller Central. If the numbers match, the parsing is trustworthy.
- Ask for the code and the row count. Reviewing excluded rows catches the silent filter that dropped a variation or a marketplace.
- Never accept volunteered benchmarks. If ChatGPT states a category conversion rate or an average ACOS, treat it as unverified and replace it with your own target from your account data.
- Strip buyer PII before upload. No names, addresses, emails, or order-level identifiers. Aggregate to ASIN-day grain whenever possible.
- Check your data controls. Review the current settings for whether conversations may be used to improve models, and consider temporary chats or a business plan if your company requires stricter handling. Confirm the present policy on OpenAI's site rather than relying on secondhand descriptions.
- Protect sensitive cost data if needed. If you cannot share absolute supplier costs, upload indexed values — multiply all costs by a constant — so margins can be compared while absolute figures stay private.
- Log your prompts. Keep the prompt, the file name, and the date together. Reproducibility is what makes an analysis defensible three months later.
The underlying principle is simple: the model is allowed to be wrong, but your process must catch it. Every number that reaches a pricing, inventory, or advertising decision should pass through at least one independent check, whether that is a manual reconciliation or a second data source.
Where ChatGPT Stops and SellerSprite Starts
The cleanest way to think about it: ChatGPT analyzes the data you already own, while marketplace intelligence tools describe the market you are selling into. Your export knows that sessions fell. It does not know that search volume for your main keyword dropped, that a competitor cut price by 15 percent, or that three new ASINs entered the top ten for your category. Those answers live outside your file.
| Question | Better first stop |
|---|---|
| Which ASIN drove last month's decline, and was it traffic or conversion? | ChatGPT with your Business Report export |
| What does my forecast range look like for the next 12 weeks? | ChatGPT, with a backtest |
| Is demand for this keyword growing or shrinking? | SellerSprite keyword research |
| Who are the current top competitors and where does their traffic come from? | SellerSprite market and traffic analysis |
| Which new product should I launch next quarter? | Marketplace product database, then ChatGPT for the sizing math |
In practice the two combine well. Use SellerSprite to size demand, pick the keywords worth ranking for, and pull competitor context. Then use ChatGPT to analyze your own sales and advertising exports against that context. If you are still building the foundation, start with the AI for Amazon FBA guide, which maps every AI use case across the selling workflow, and pair it with these ChatGPT prompts for Amazon listings for the copy and keyword side of the same data. For a broader view of where AI fits across an Amazon business, see how Amazon sellers use ChatGPT.
When you are ready to put market data next to your own analysis, you can create a free SellerSprite account and run your first keyword and competitor pull, then feed the resulting demand estimates into the same ChatGPT workbook you already built.
A Repeatable Weekly and Monthly Routine
The analysis only pays off if it repeats. Here is a cadence that fits a small team and scales to a brand with several analysts.
Weekly, about 15 minutes:
- Refresh the Business Report export and upload it with your saved prompt.
- Review the week-over-week KPI delta and the top three movers, up and down.
- Check the search term report for spend with no orders and flag negatives.
- Confirm no SKU is projected to stock out inside the lead time window.
Monthly, about 60 minutes:
- Rebuild the 12-month KPI table and the decomposition for the month just closed.
- Refresh the forecast, re-run the backtest, and record the error for next month's comparison.
- Review margin by SKU after fees and freight, not revenue alone.
- Annotate promo dates and stockouts so next month's model does not learn the wrong pattern.
- Update your keyword and competitor context before setting next month's targets.
Keep one shared folder with three things per cycle: the raw export, the prompt and script used, and the output workbook. That archive is what turns a clever chat into an operating system your team can inherit.
Common Mistakes That Wreck AI Sales Analysis
- Uploading the raw Seller Central file untouched. Title rows, footers, and text-formatted numbers produce confident nonsense.
- Mixing grains. Daily and monthly rows in one sheet double-count units and corrupt every downstream total.
- Asking a vague question. Tell me how sales are doing returns a paragraph. Name the metric, the period, and the comparison and you get a table.
- Ignoring stockouts. Forecasting from censored demand leads directly to under-ordering and a second stockout.
- Trusting a point forecast. Without a backtest and a range, a forecast is a guess with decimal places.
- Accepting invented benchmarks. Any category average the model volunteers is unverified. Use your own account data.
- Skipping the export step. If the result lives only in the chat, you cannot share it, audit it, or re-run it.
- Analyzing revenue instead of margin. A bestseller with negative contribution margin still loses money at scale.
- Uploading personally identifiable data. It adds risk and improves nothing in the analysis.
FAQ
How do I use ChatGPT Code Interpreter to analyze my sales data?
Export a clean CSV or Excel file from Seller Central — typically the Detail Page Sales and Traffic by ASIN report, plus your ad and inventory reports — then attach it to a ChatGPT conversation that has data analysis enabled. Ask first for a schema check and a data-quality audit, then request the KPI table, the change decomposition, the charts, and finally the forecast with a backtest. Finish by asking for the Python script and an Excel export so the analysis is reproducible. Reconcile one month of units and sales against Seller Central before you act on anything.
What types of sales reports can ChatGPT Code Interpreter generate from a CSV file?
From a single clean export you can produce monthly and weekly KPI tables with units, revenue, sessions, conversion rate, average selling price, and return rate; week-over-week and month-over-month change tables; price versus volume decomposition; ASIN contribution rankings; margin reports when you supply cost and fee data; seasonality comparisons year over year; reorder and stockout projections when you supply lead times; and advertising waste lists from a search term report. It can also deliver charts and a multi-tab Excel workbook. Anything requiring marketplace data you do not own — keyword volume, competitor traffic, category benchmarks — cannot be generated from your file alone.
Is ChatGPT Code Interpreter accurate for sales forecasting and trend analysis?
Trend analysis is usually reliable when the file is clean, because it is arithmetic on your own numbers and you can verify it against Seller Central. Forecasting is more nuanced: the model fits standard statistical methods to your history, so accuracy depends on data length, stockout gaps, promotional spikes, and structural changes such as a new variation or a price step. Always request a backtest with the error expressed as a percentage of actual units, and use the low, base, and high scenarios for planning rather than a single number. Treat the forecast as a structured starting point for a human decision, not as a prediction you can hand straight to a supplier.
Is it safe to upload my Amazon sales data to ChatGPT?
Aggregated business data such as ASIN-level units, sessions, and ad spend is generally the lower-risk category, while anything containing buyer names, addresses, emails, or order identifiers should be removed before upload. Review your ChatGPT plan's current data controls to understand whether conversations may be used to improve models, and use temporary chats or business tiers where your company requires stricter handling. If absolute supplier costs are sensitive, upload indexed values instead of real figures so margins can still be compared. Confirm the present policy on OpenAI's site, since the terms and settings change over time.
How is ChatGPT Code Interpreter different from an AI sales data analysis tool?
Code Interpreter is a general-purpose analyst for files you supply: flexible, conversational, and excellent for ad-hoc questions, but it has no live connection to any marketplace and no memory between sessions. A dedicated sales or marketplace intelligence tool connects to structured data, refreshes on a schedule, and covers external context such as keyword demand, competitor movement, and category trends. Most mature sellers use both — the platform for market context and monitoring, the chat session for the deep dive on their own exports.
Can it build a dashboard I can refresh every day?
Not natively. Charts and tables generated in a chat are static, with no scheduled refresh or interactive filters. The practical pattern is to let ChatGPT clean and shape the data, export the result as CSV or Excel, and load that file into a spreadsheet template or a lightweight BI tool for the daily view. Then return to the chat whenever a number looks wrong and you need a custom investigation that a fixed dashboard cannot answer.
Next Steps
- Export the Detail Page Sales and Traffic report for the last 12 months and apply the cleaning rules from Step 1 — one header row, a real date column, numeric fields, one row per ASIN per day.
- Run the schema check and data-quality audit prompts, then reconcile one full month of units and sales against Seller Central before going further.
- Complete the seven-step walkthrough once, save the Python script, and schedule the weekly and monthly routine into your calendar.
- Add market context so your analysis explains the why, not just the what — sign up for SellerSprite to pull keyword demand and competitor data, and start with the AI for Amazon FBA guide for the full workflow map.
References
- OpenAI Help Center — data analysis and file handling in ChatGPT View
- OpenAI — ChatGPT release notes and plan availability View
- Amazon Seller Central Help — Business Reports and Detail Page Sales and Traffic View
- Amazon Ads Help — reporting for Sponsored Products campaigns and search terms View
- SellerSprite Blog — AI for Amazon FBA: the complete workflow guide View
Interface names, plan features, and data-handling policies on OpenAI and Amazon change frequently. Confirm the current wording in your own accounts before publishing an internal process based on this guide.
By SellerSprite Content Expert
Amazon seller tools and marketplace SEO specialist.
Editorial process: AI-assisted draft prepared for human fact-checking, source verification, and brand review before publication.