TL;DR: High-ticket products offer advantages in profit per order and advertising headroom, while low-ticket products typically require less capital to launch and allow for faster cash recovery. The better choice depends on your available capital, product category, and inventory turnover rate rather than selling price alone.
Key Takeaways
- There is no universal price threshold: high ticket and low ticket describe buying behavior and order economics, not quality.
- Profit per order, rather than profit margin percentage, determines how many sales you need to reach your profit target and how much you can afford to spend per click.
- Low-ticket products are cheaper to test but fragile at scale; high-ticket products fund advertising but punish slow inventory and returns.
- Run the cash-flow test and a full fee recalculation before committing capital, then stress-test with higher ad costs and return rates.
Table of Contents
- The Decision Behind Every Other Decision
- High Ticket vs. Low Ticket Products: What Is the Real Difference?
- The Profit Illusion: Why a Higher Selling Price Does Not Always Mean More Money
- Why Low-Ticket Products Are Easier to Start but Harder to Scale Profitably
- Why High-Ticket Products Offer More Revenue per Sale but Demand More Trust
- Advertising Changes the Winner: Which Ticket Size Can Afford a Customer?
- The Cash-Flow Test: Which Product Uses Your Working Capital Better?
- The Amazon Fee Structure Can Reverse Your Pricing Advantage
- Can You Turn a Low-Ticket Product Into a Higher-Value Offer?
- Which Product Model Fits Your Business? A Decision Framework
- How to Compare Opportunities Using SellerSprite
- Final Verdict: Is High Ticket or Low Ticket Better?
- FAQ
- References
Note on marketplaces: This guide is specifically optimized for the US market.
The Decision Behind Every Other Decision
Choosing between high-ticket and low-ticket products is the first real strategic decision most Amazon sellers face, and it quietly determines your inventory budget, advertising math, cash-flow cycle, and tolerance for risk. Yet the debate is usually framed around which option makes more money, a question with no universal answer because the winning model depends on how your capital, category, and operating skills interact.
Before you pick a side, decide what you are optimizing for: speed of learning, absolute monthly profit, cash recovery time, or brand equity. Each objective points to a different answer. The sections below examine the factors that actually influence profitability, including unit economics, Amazon fees, advertising affordability, and working capital, so you can move beyond comparing price tags and start evaluating potential outcomes.
High Ticket vs. Low Ticket Products: What Is the Real Difference?
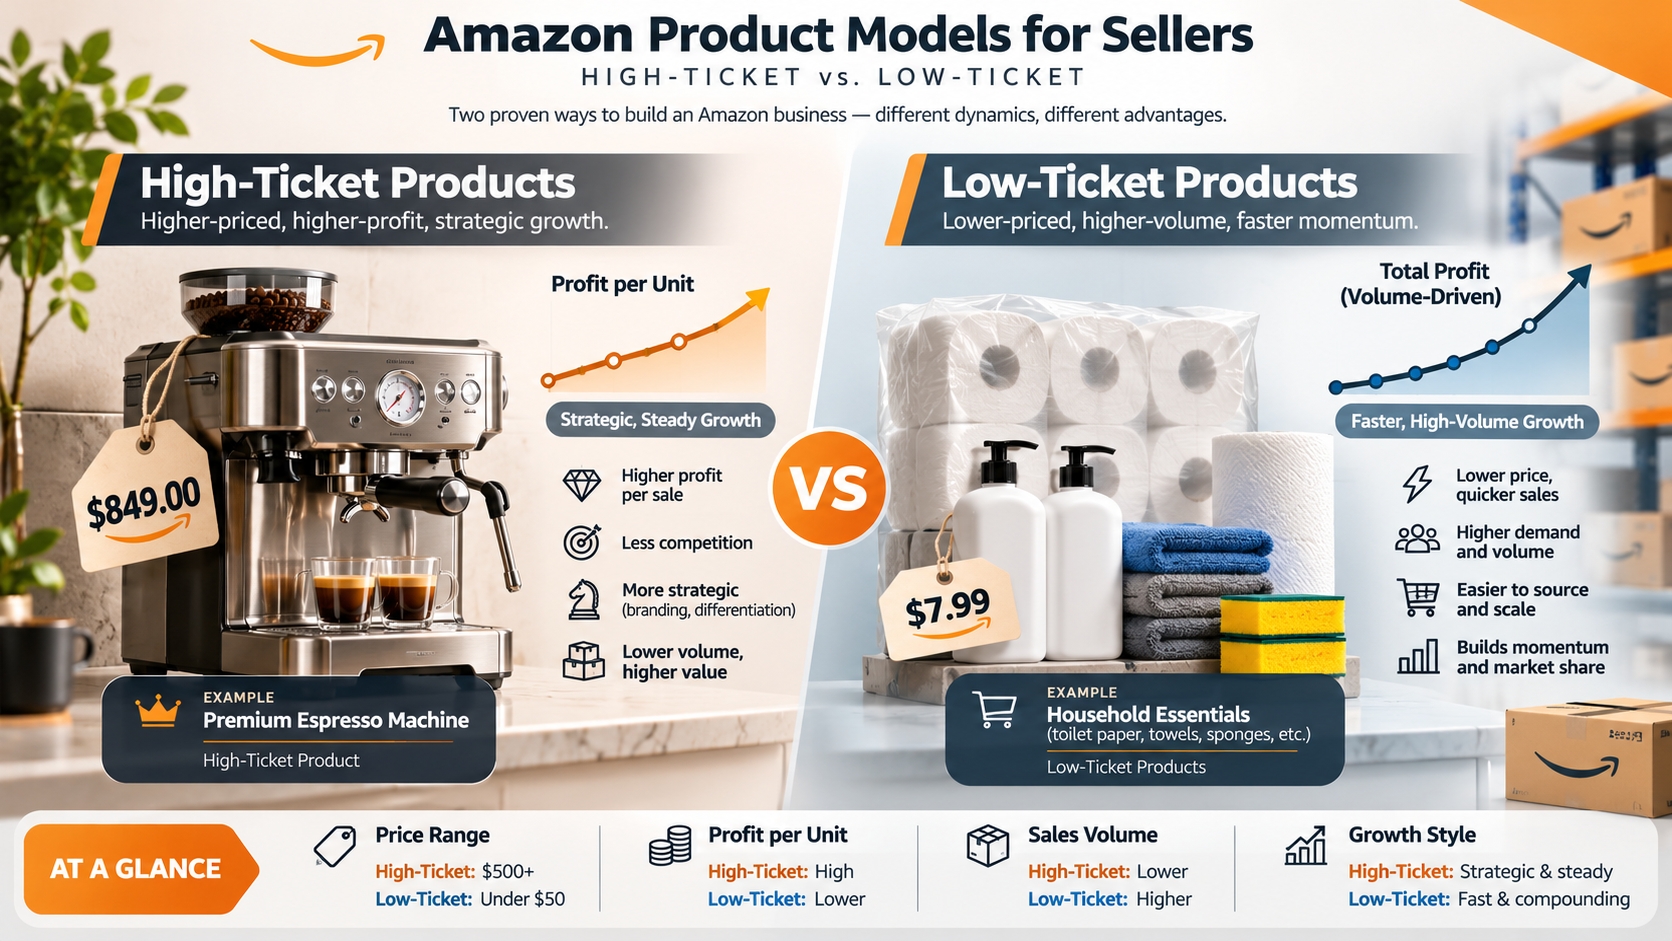
In practice, "high ticket" and "low ticket" describe how much money changes hands per order and how much consideration precedes that order. A high-ticket product typically costs well above the category average, triggers comparison shopping and review reading, and carries more risk per unit returned. A low-ticket product is normally an impulse or replenishment purchase decided in seconds and repurchased often. Neither label reflects product quality or the seller's ambitions. Instead, both describe purchasing behaviors that influence how you price, market, and finance the product.
Working definitions used in this guide
- High ticket: higher price per unit, longer consideration cycle, higher risk per failed order, fewer orders needed to hit a profit target.
- Low ticket: lower price per unit, faster decision, repeat-purchase potential, many more orders needed to hit the same target.
Treat any dollar figure as directional. Confirm current Amazon fees before finalizing a price.
Why There Is No Universal Price Threshold for High-Ticket Products
For some sellers $50 is high ticket; for others the line sits near $200 or $500. The threshold moves with the category, the customer's reference prices, and your own cost structure. A $120 item where the median is $25 is a premium purchase that needs justification, while the same $120 where competitors sell at $300 feels like a bargain. A more reliable test than a fixed number is the ratio of your price to the category median and how much explanation that premium requires.
Selling Price, Average Order Value, and Perceived Value Are Not the Same
A $9.99 single item and a $9.99 three-pack share a selling price but differ sharply in average order value, unit cost, and return rate. Average order value measures what a shopper actually spends per checkout; perceived value measures whether they believe the price is fair. Confusing these three concepts can lead to poor decisions, such as discounting a product that customers already perceive as good value or creating bundles that increase fulfillment costs enough to offset the additional revenue. Track price per unit, AOV, and the review language that reveals perceived value as separate metrics.
Why Comparing Products Within the Same Category Matters More Than Comparing Price Tags
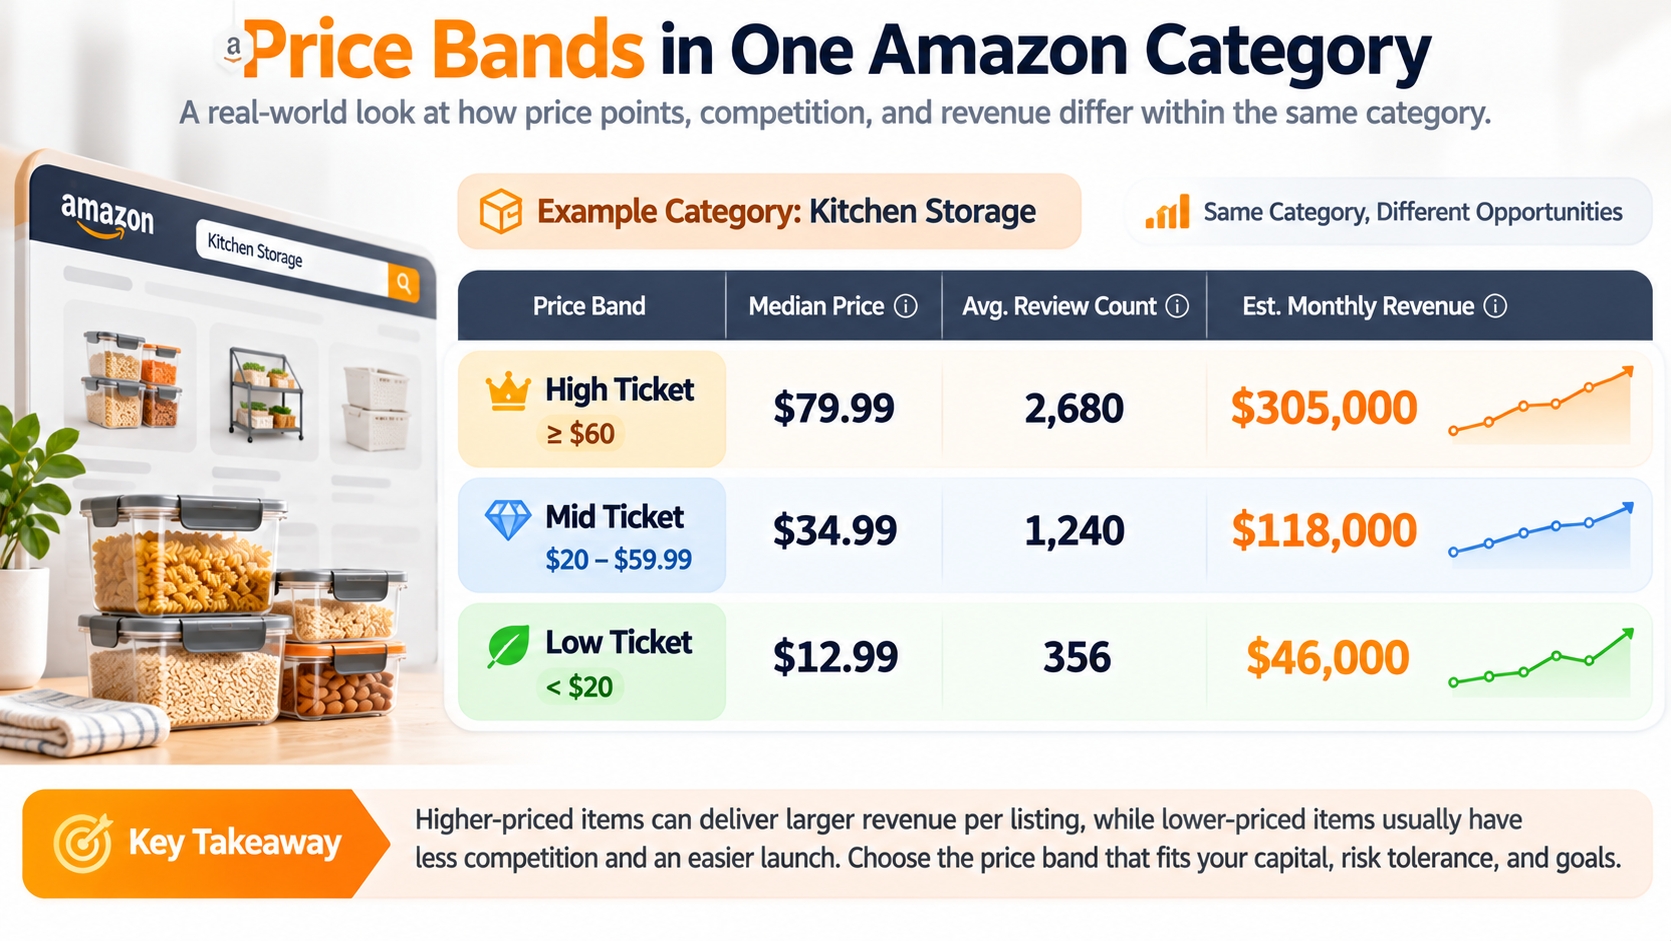
Comparing a $15 kitchen gadget to $150 home fitness equipment tells you almost nothing, because referral fee rates, size and weight tiers, return behavior, and competitive CPCs all differ by category. Compare inside one category instead: take the top price band and the bottom band, then contrast demand, review counts, and margin at each end. That isolates price as a variable instead of blending it with category-level forces you cannot control.
The Profit Illusion: Why a Higher Selling Price Does Not Always Mean More Money
A higher selling price often translates into greater profit, but the underlying reasons are rarely what sellers assume. Profit per order grows faster than price only when fees and cost of goods scale favorably. Referral fees usually take a percentage of price, so they scale with your price, while fulfillment fees scale with size and weight instead. That mismatch is exactly where a pricing advantage can flip, and where a cheap product can quietly outperform an expensive one.
| Illustrative metric | Low ticket ($14.99) | High ticket ($149.00) |
|---|---|---|
| Referral fee (15% assumed) | $2.25 | $22.35 |
| Fulfillment fee (assumed) | $3.30 | $9.80 |
| Landed cost per unit | $4.00 | $55.00 |
| Contribution before ads | $5.44 | $61.85 |
| Contribution margin | 36% | 42% |
| Orders for $10,000 profit | 1,838 | 162 |
The underlying economics matter more than the exact figures. The high-ticket product generates roughly eleven times as much contribution profit per sale and requires approximately one-tenth as many orders to reach the same profit target. However, this advantage only holds if you can consistently generate those 162 orders at a sustainable conversion rate. The fee assumptions above are illustrative, so always verify current rates using Amazon's official pricing resources.
Profit Margin Percentage vs. Actual Profit per Order
Margin percentage flatters cheap products. A 45% margin on a $12 item sounds healthier than a 22% margin on a $400 item, yet the second produces far more cash per transaction. Percentage is a ratio; profit per order is the money you can reinvest in advertising, packaging, and support. Report both, plus contribution dollars per month, and never let a high percentage hide a small absolute number.
How Selling Fees, Fulfillment Costs, and Advertising Change the Comparison
Referral fees are commonly a percentage of price with category-specific rates and minimum fees, while FBA fulfillment fees follow size and weight tiers, and advertising costs follow your own efficiency. Only advertising scales with skill rather than with price, which is why it becomes the deciding variable once product economics are close. Build a complete cost stack, including price, referral fee, fulfillment fee, storage, returns, and cost of goods, before you compare two products.
The Number of Orders Each Product Needs to Reach the Same Profit Target
Working back from a monthly profit goal forces honest thinking about demand. To earn $10,000 in contribution, a $5-per-order product needs 2,000 orders; a $60-per-order product needs 167. Then ask whether each niche's keyword pool can supply that volume. Many sellers discover the premium niche cannot deliver 2,000 orders a month and the cheap niche cannot deliver 167 orders at a $60 margin. Let the arithmetic, not the slogan, decide.
Why Low-Ticket Products Are Easier to Start but Harder to Scale Profitably
Low-ticket products have a deserved reputation as a training ground because they are cheap to test, easy to explain, and forgiving of imperfect listings. The problem arrives later. Because contribution per order is small, every inefficiency, whether a small fee increase, a five-point ad cost overrun, or a slightly higher return rate, consumes a large share of profit. Scaling a cheap product profitably demands operational discipline that most beginners have not built yet.
Lower Inventory Investment Makes Product Testing More Accessible
A 500-unit test order of a $4-cost item is roughly $2,000; the same test on a $55-cost item is north of $25,000. That gap is the strongest argument for starting low ticket: you can run two or three experiments, kill the losers, and double down on a winner without exhausting capital. Treat early products as paid experiments, budget the loss in advance, and define the kill criteria before you order.
Affordable Prices Can Reduce Purchase Friction and Encourage Repeat Orders
Consumables, refills, and accessories create subscription-like behavior: customers return without you paying again for the click. That repeat demand can lift lifetime value and stabilize rankings. However, repeat orders only help if each one is profitable. A replenishable product with a $1.20 contribution and a 12% return rate can quietly lose money on every reorder while still looking healthy on a dashboard.
High Sales Volume Can Hide Weak Contribution Margins
Volume is seductive and misleading. A listing moving 400 units a day looks like a triumph until you subtract returns, removal fees, coupon redemptions, and ad spend, which can sometimes reveal a contribution margin in the low single digits. Audit at the order level every month. If a product's contribution per order cannot absorb a 10% cost shock, high sales volume becomes a source of exposure rather than protection.
Price Wars and Rising PPC Costs Can Quickly Eliminate Profit
Low-ticket categories attract many sellers precisely because the entry barrier is low, and that is what compresses margins. When ten sellers offer near-identical cheap items, price becomes the only differentiator, and bids climb while prices fall. The only comfortable winners are sellers with a structural cost advantage or a genuine brand. Check price history and ad density in a niche before you commit inventory to it.
Why High-Ticket Products Offer More Revenue per Sale but Demand More Trust
High-ticket selling shifts the primary challenge from logistics to credibility. A customer spending several hundred dollars is not simply comparing prices, but also evaluating the risks associated with the purchase. They read negative reviews first, check the return policy, look for brand signals, and often compare your listing against a familiar name. Your job is to make the purchase feel safe, not merely attractive, and that work costs time and money before the first sale arrives.
Higher Order Values Can Create More Room for Advertising and Differentiation
With $60 of contribution per order you can afford a four- or five-dollar click and still profit; with $5 of contribution, a one-dollar click may already be too expensive. That headroom funds competitive head-term bids, video creative, and better imagery and A+ content. It also pays for differentiation cheap products cannot afford: custom tooling, premium materials, better packaging, and real product improvements rather than cosmetic ones.
Premium Products Need Stronger Evidence Before Customers Buy
At a higher price, claims must be proven. That means comparison charts, dimension diagrams, compatibility lists, warranty terms, user-generated video, and reviews that specifically address durability and ease of use. Listings built on adjectives ("premium quality") convert poorly; listings that answer the five most common objections convert well. Budget for review acquisition and post-purchase follow-up as part of the product cost, not as an optional extra.
Slow-Moving Inventory Can Tie Up Cash Even When Margins Look Attractive
A 42% contribution margin is irrelevant if the units sit for five months. High-ticket inventory absorbs cash in large blocks: one shipment of $55-cost goods can represent more working capital than a full year of cheap-product cash flow. Slow velocity also raises storage fees and the risk of markdowns when a model is superseded. Model inventory days and sell-through rate alongside margin, never instead of it.
Returns, Damage, and After-Sales Support Can Make Each Failed Order Expensive
A returned $15 item costs a few dollars in handling. A returned $400 item can involve two-way shipping, inspection, refurbishment, and a period of unsellable inventory, with these expenses potentially consuming a meaningful share of the sale. Heavy or fragile products multiply that risk. Before choosing a premium category, estimate the true cost of one failed order and check whether your contribution margin can absorb a return rate even two percentage points above the category norm.
Advertising Changes the Winner: Which Ticket Size Can Afford to Acquire a Customer?
Advertising is where most pricing debates are settled, because it turns abstract margin into a concrete acquisition budget. Two products can look equally profitable on a spreadsheet and behave completely differently once you must pay for traffic. The question is not how expensive clicks are in general; it is whether your profit per order can survive the click price your category actually demands.
Why CPC Alone Does Not Tell You Whether a Product Is Worth Advertising
A $3 cost per click is catastrophic for a $4-contribution product and comfortable for a $60-contribution one. Cost per click only becomes meaningful when compared against profit per order and conversion rate. Sellers who benchmark CPCs across unrelated categories draw the wrong conclusions, because the correct benchmark is your own maximum affordable CPC, calculated from your own economics and your own listing's conversion.
How Conversion Rate and Profit per Order Determine Your Maximum Affordable CPC
The ceiling is simple arithmetic: maximum affordable CPC is roughly contribution profit per order before ads multiplied by conversion rate. The relationship is important because cheap products usually convert better but can still afford dramatically less per click, while premium products tend to convert at lower rates but can absorb much higher bids. That single calculation explains why so many sellers of inexpensive items struggle to scale with paid traffic.
Quick rule: maximum affordable CPC
Max CPC ≈ contribution profit per order before ads × conversion rate
- High ticket: $61.85 × 8% ≈ $4.95 per click
- Low ticket: $5.44 × 15% ≈ $0.82 per click
If your category's real bids sit above this ceiling, the product cannot be scaled with paid traffic. Verify with current bid data before you order inventory.
Break-Even ACoS Is Different for Every Product
Break-even ACoS is roughly contribution profit before ads divided by selling price, so it shifts with cost of goods, fee tier, and returns. Two products at the same price in the same category can have break-even ACoS values ten points apart purely because of sourcing cost. Set targets per SKU rather than per account, and remember that break-even is a floor, not a goal. You still need profit after advertising.
When Organic Search Visibility Matters More Than Paid Sales Volume
If a product's economics only work at low ad spend, then organic ranking is the real business, and advertising is a temporary subsidy. That favors products with review velocity, repeat purchase, and defensible differentiation. High-ticket buyers research longer and often arrive through organic search, video, and external sources, while low-ticket shoppers can be won through high-intent replenishment keywords. Either way, plan the paid-to-organic transition before scaling spend.
The Cash-Flow Test: Which Product Makes Better Use of Your Working Capital?
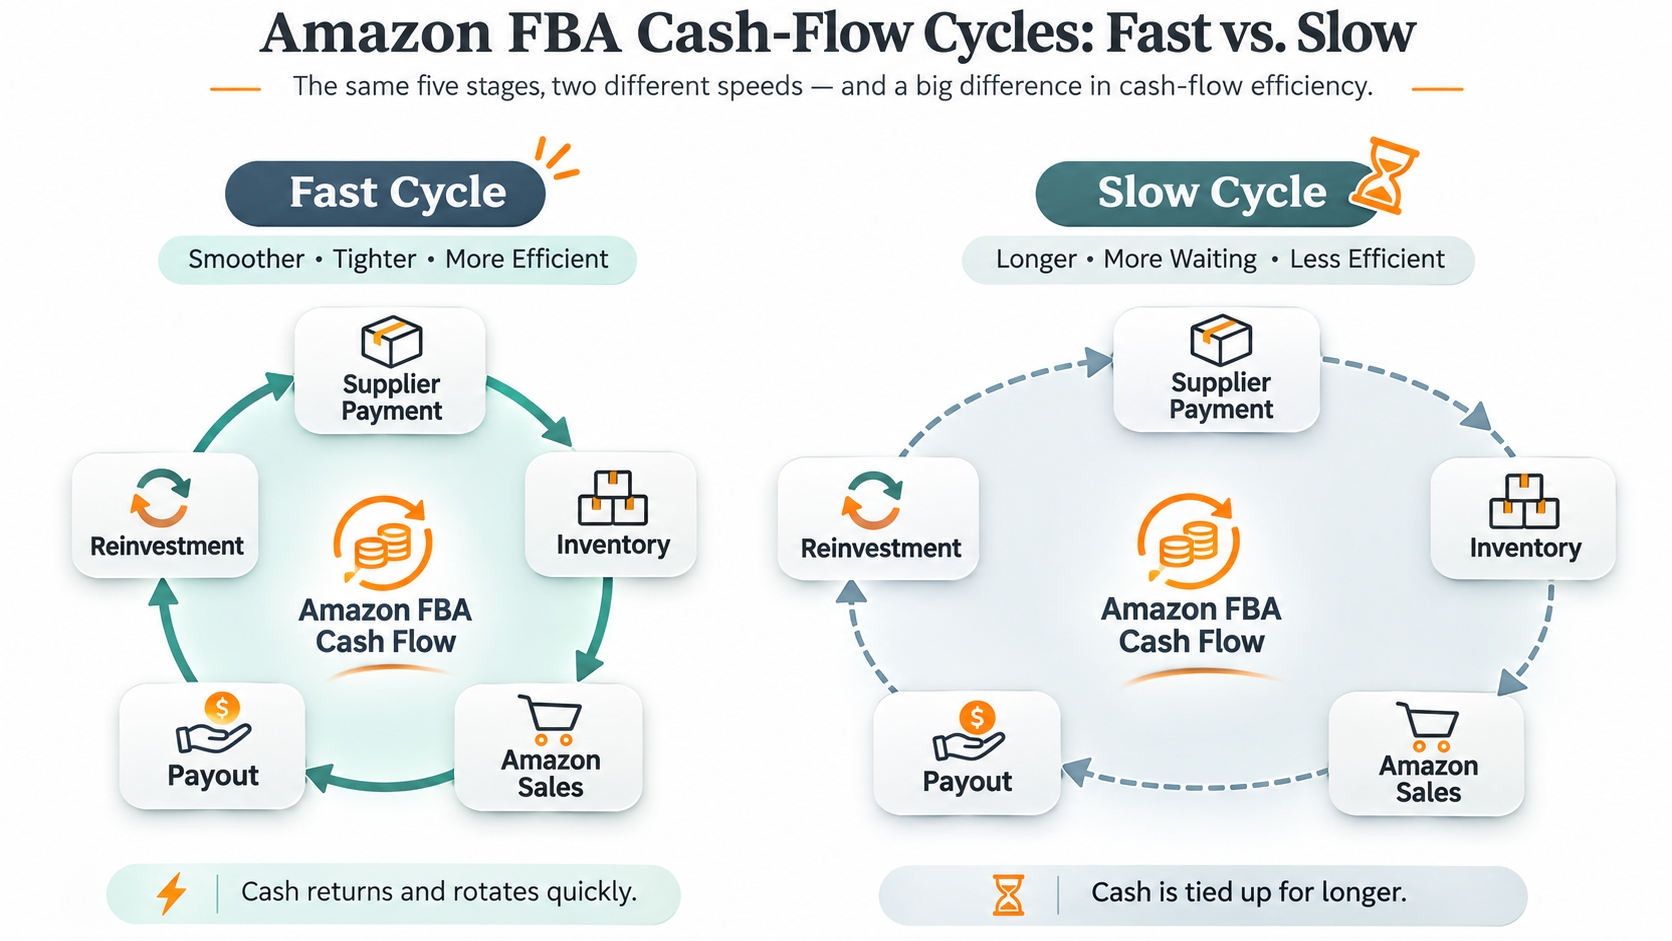
Profitability and liquidity are different questions. A product can be profitable on paper and still strain your business if cash sits in inventory for four months. The cash-flow test asks a blunt question: how quickly does each dollar you invest return, and how much of it comes back as usable profit rather than replacement stock?
Compare Inventory Investment, Not Just Profit per Unit
Compare total cash outlay per test cycle. A cheap product may need $2,000 to launch a test; a premium product may need $15,000 for a minimum order quantity plus tooling. Put both against expected monthly contribution and calculate months to recover the initial investment. The winner is often the product with faster payback, even when its margin percentage is unremarkable by comparison.
How Sales Velocity and Reorder Cycles Affect Cash Recovery
If a product sells 300 units a month and your supplier lead time is 45 days, you must place the next order before the current one is halfway gone. Fast velocity with long lead times demands more working capital than slow velocity with domestic suppliers. Map reorder cycles against sales velocity and add a buffer for delays, because stockouts can damage rankings while overstock ties up cash, and both can be costly.
The Hidden Cost of Unsold High-Ticket Inventory
Unsold premium inventory accrues storage fees, locks up capital, and loses value with each new model release. Aged-inventory surcharges and removal costs can turn a temporarily slow SKU into a realized loss. Before committing to a high-ticket SKU, model the pessimistic case: if only 30% of your first order sells within six months instead of three, does the product still make sense?
Why Fast Inventory Turnover Can Make a Lower-Margin Product More Attractive
A product that returns your capital every 40 days can be reinvested nine times a year; a slow product returns it twice. Annualized return on working capital, rather than margin per unit, is the metric that determines how effectively your capital generates returns over time. Many successful sellers deliberately run faster-turnover, lower-margin lines alongside a small number of premium hero products, letting each cover the other's weakness.
Cash-flow checklist before you commit capital
- Months to recover the first order's full cash outlay
- Inventory days at your realistic, not optimistic, sales velocity
- Worst-case sell-through of 50% and the resulting storage cost
- Reorder lead time versus the cash you will have tied up while waiting
The Amazon Fee Structure Can Reverse Your Pricing Advantage
Amazon's fee schedule is not neutral between price tiers. Referral fees usually scale with price within category rate bands, subject to minimum fees, while fulfillment fees scale with dimensions and weight. That asymmetry produces counterintuitive results: occasionally raising a price improves margin, and sometimes splitting a product into a multipack does more for profit than any advertising optimization ever could.
How Category-Specific Referral Fees Affect High- and Low-Ticket Products
Referral fee percentages differ by category and are commonly around 15%, though some categories use tiered rates. Because the fee is proportional, a high price is not penalized disproportionately. The real pressure point is the minimum referral fee on very cheap items, which can consume a large share of a low-ticket unit's revenue. Always confirm current rates on Amazon's official pricing documentation.
Why Low-Price FBA Does Not Automatically Make Cheap Products More Profitable
Low-Price FBA reduces fulfillment cost for eligible low-priced items, and it genuinely improves the math for products under the applicable threshold. But the savings are measured in cents to a couple of dollars per unit. If contribution is thin because of sourcing cost, advertising, or returns, a fulfillment discount will not rescue the product. Treat Low-Price FBA as an incremental improvement to an already sound model, not as a business model in itself.
When Product Size and Weight Matter More Than Selling Price
A $12 item that is bulky and heavy can pay more in fulfillment fees than a $90 item that is small and light. Dimensional weight tiers can erase an apparent pricing advantage overnight, and oversize surcharges are unforgiving. Before comparing price bands, compare FBA size tiers, because the product with the lowest fulfillment costs in a category is often the most profitable, regardless of its selling price.
Why Every Major Pricing or Bundle Change Needs a New Fee Calculation
Fees are tiered, so small changes cross thresholds. Adding half an inch of packaging can move a product into a higher size tier; bundling two units can change both referral and fulfillment math; a price increase can shift competitive position without changing costs at all. Recalculate all relevant costs, including referral fees, fulfillment fees, storage, returns, and advertising, whenever the product's price, dimensions, or pack size changes.
Can You Turn a Low-Ticket Product Into a Higher-Value Offer?
Sometimes the smartest answer is neither pure high ticket nor pure low ticket, but a deliberate move up the value ladder using the same customer base and the same keyword rankings. Multipacks, premium versions, accessories, and kits let you raise average order value without rebuilding your entire operation or abandoning the demand you have already earned.
When Multipacks Increase Profit per Order Without Multiplying Acquisition Costs
A two-pack or three-pack spreads one advertising click across more revenue, which usually improves contribution per order without doubling PPC spend. Bundling works when additional units result in only a modest increase in fulfillment costs and customers genuinely benefit from buying larger quantities, as is often the case with consumables, household items, and craft supplies. It becomes less effective when the bundle moves into a higher size tier, increases storage costs, or offers more units than customers actually need.
How Premium Materials, Features, and Accessories Support Higher Prices
Premium versions succeed when the upgrade is visible and easy to justify: a stronger material, a longer warranty, a genuinely better mechanism, or a complete kit that removes a second purchase. Upgrade to solve a specific complaint from your reviews, not to add a vague "pro" label. If buyers mention flimsiness, breakage, or missing parts, that feedback is a roadmap to a higher-priced SKU.
When Bundling Creates Value and When It Only Adds Cost
Bundling creates value when the combined product saves a decision, a purchase, or a compatibility risk. It only adds cost when the items are unrelated, when packaging pushes the bundle into a higher size tier, or when returns increase because one component disappoints. Test bundle economics the same way you test a new product: contribution per order after all fees, returns, and added fulfillment complexity.
Test Customer Willingness to Pay Before Rebuilding Your Product Line
Willingness to pay is measurable before you commit capital. Run careful price tests on existing listings, watch conversion-rate sensitivity, analyze price-related review complaints, and study higher-priced competitors to see what evidence they present. A modest price test on a live listing often reveals more about demand elasticity than a month of desk research, and it costs far less than a new mold.
Which Product Model Fits Your Business? A Decision Framework for Amazon Sellers
The right answer depends less on the product than on the operator. Available capital, tolerance for risk, existing brand equity, and operational capacity all shift the balance. Use the framework below to match your situation to a default model, then adjust based on the specific category you are evaluating.
| Seller profile | Default model | Why it fits | Main risk |
|---|---|---|---|
| New seller, limited capital | Mid-priced differentiator | Affordable to test, enough margin to learn advertising | Crowded price wars |
| Budget under a few thousand dollars | Low ticket, fast turnover | Small test orders, quick capital recovery | Thin margins, rising CPCs |
| Established brand with reviews | High-ticket extension | Existing trust lowers acquisition cost | Slow inventory, return costs |
| Strong supply-chain cost edge | High-volume low ticket | Structural cost advantage protects margin | Fee and bid inflation eroding the edge |
New Sellers: Choose a Manageable Risk Profile, Not Simply the Cheapest Product
The goal of your first product is to learn the entire selling process, including sourcing, listing optimization, advertising, returns, and restocking, without putting the business at significant financial risk. That usually points to a mid-priced product with a real point of difference, not the cheapest item on the page. A $6 gadget teaches the same lessons as a $40 one but leaves almost no room for error and attracts the heaviest price competition.
Budget-Constrained Sellers: Prioritize Capital Recovery and Small Test Orders
If your total budget is a few thousand dollars, prioritize products with fast turnover, small minimum order quantities, and simple fulfillment. Negotiate a smaller first order with your supplier, use faster shipping for the test batch if it shortens the learning cycle, and prove the economics before placing a bulk order. Cash stuck in unproven inventory is the most common way small sellers stall.
Established Brands: Evaluate Pricing Power, Customer Trust, and Product Expansion
If you already have reviews, repeat customers, and a recognizable brand, high-ticket extensions are usually the higher-leverage move: existing trust reduces the cost of convincing a premium buyer. Evaluate whether your brand can credibly justify a higher price, then use bundles, premium tiers, and accessories to raise average order value on traffic you are already paying for.
When a Mixed High-Ticket and Low-Ticket Portfolio Makes Strategic Sense
A mixed portfolio can balance cash flow and profit: fast-turnover low-ticket lines keep capital cycling and fund operations, while a small number of high-ticket hero products deliver disproportionate profit. The biggest risk is operational complexity, including too many SKUs, divided attention, and inventory spread too thinly to generate meaningful results. Keep your product mix manageable and evaluate every SKU using the same unit economics model.
How to Compare High-Ticket and Low-Ticket Opportunities Using SellerSprite
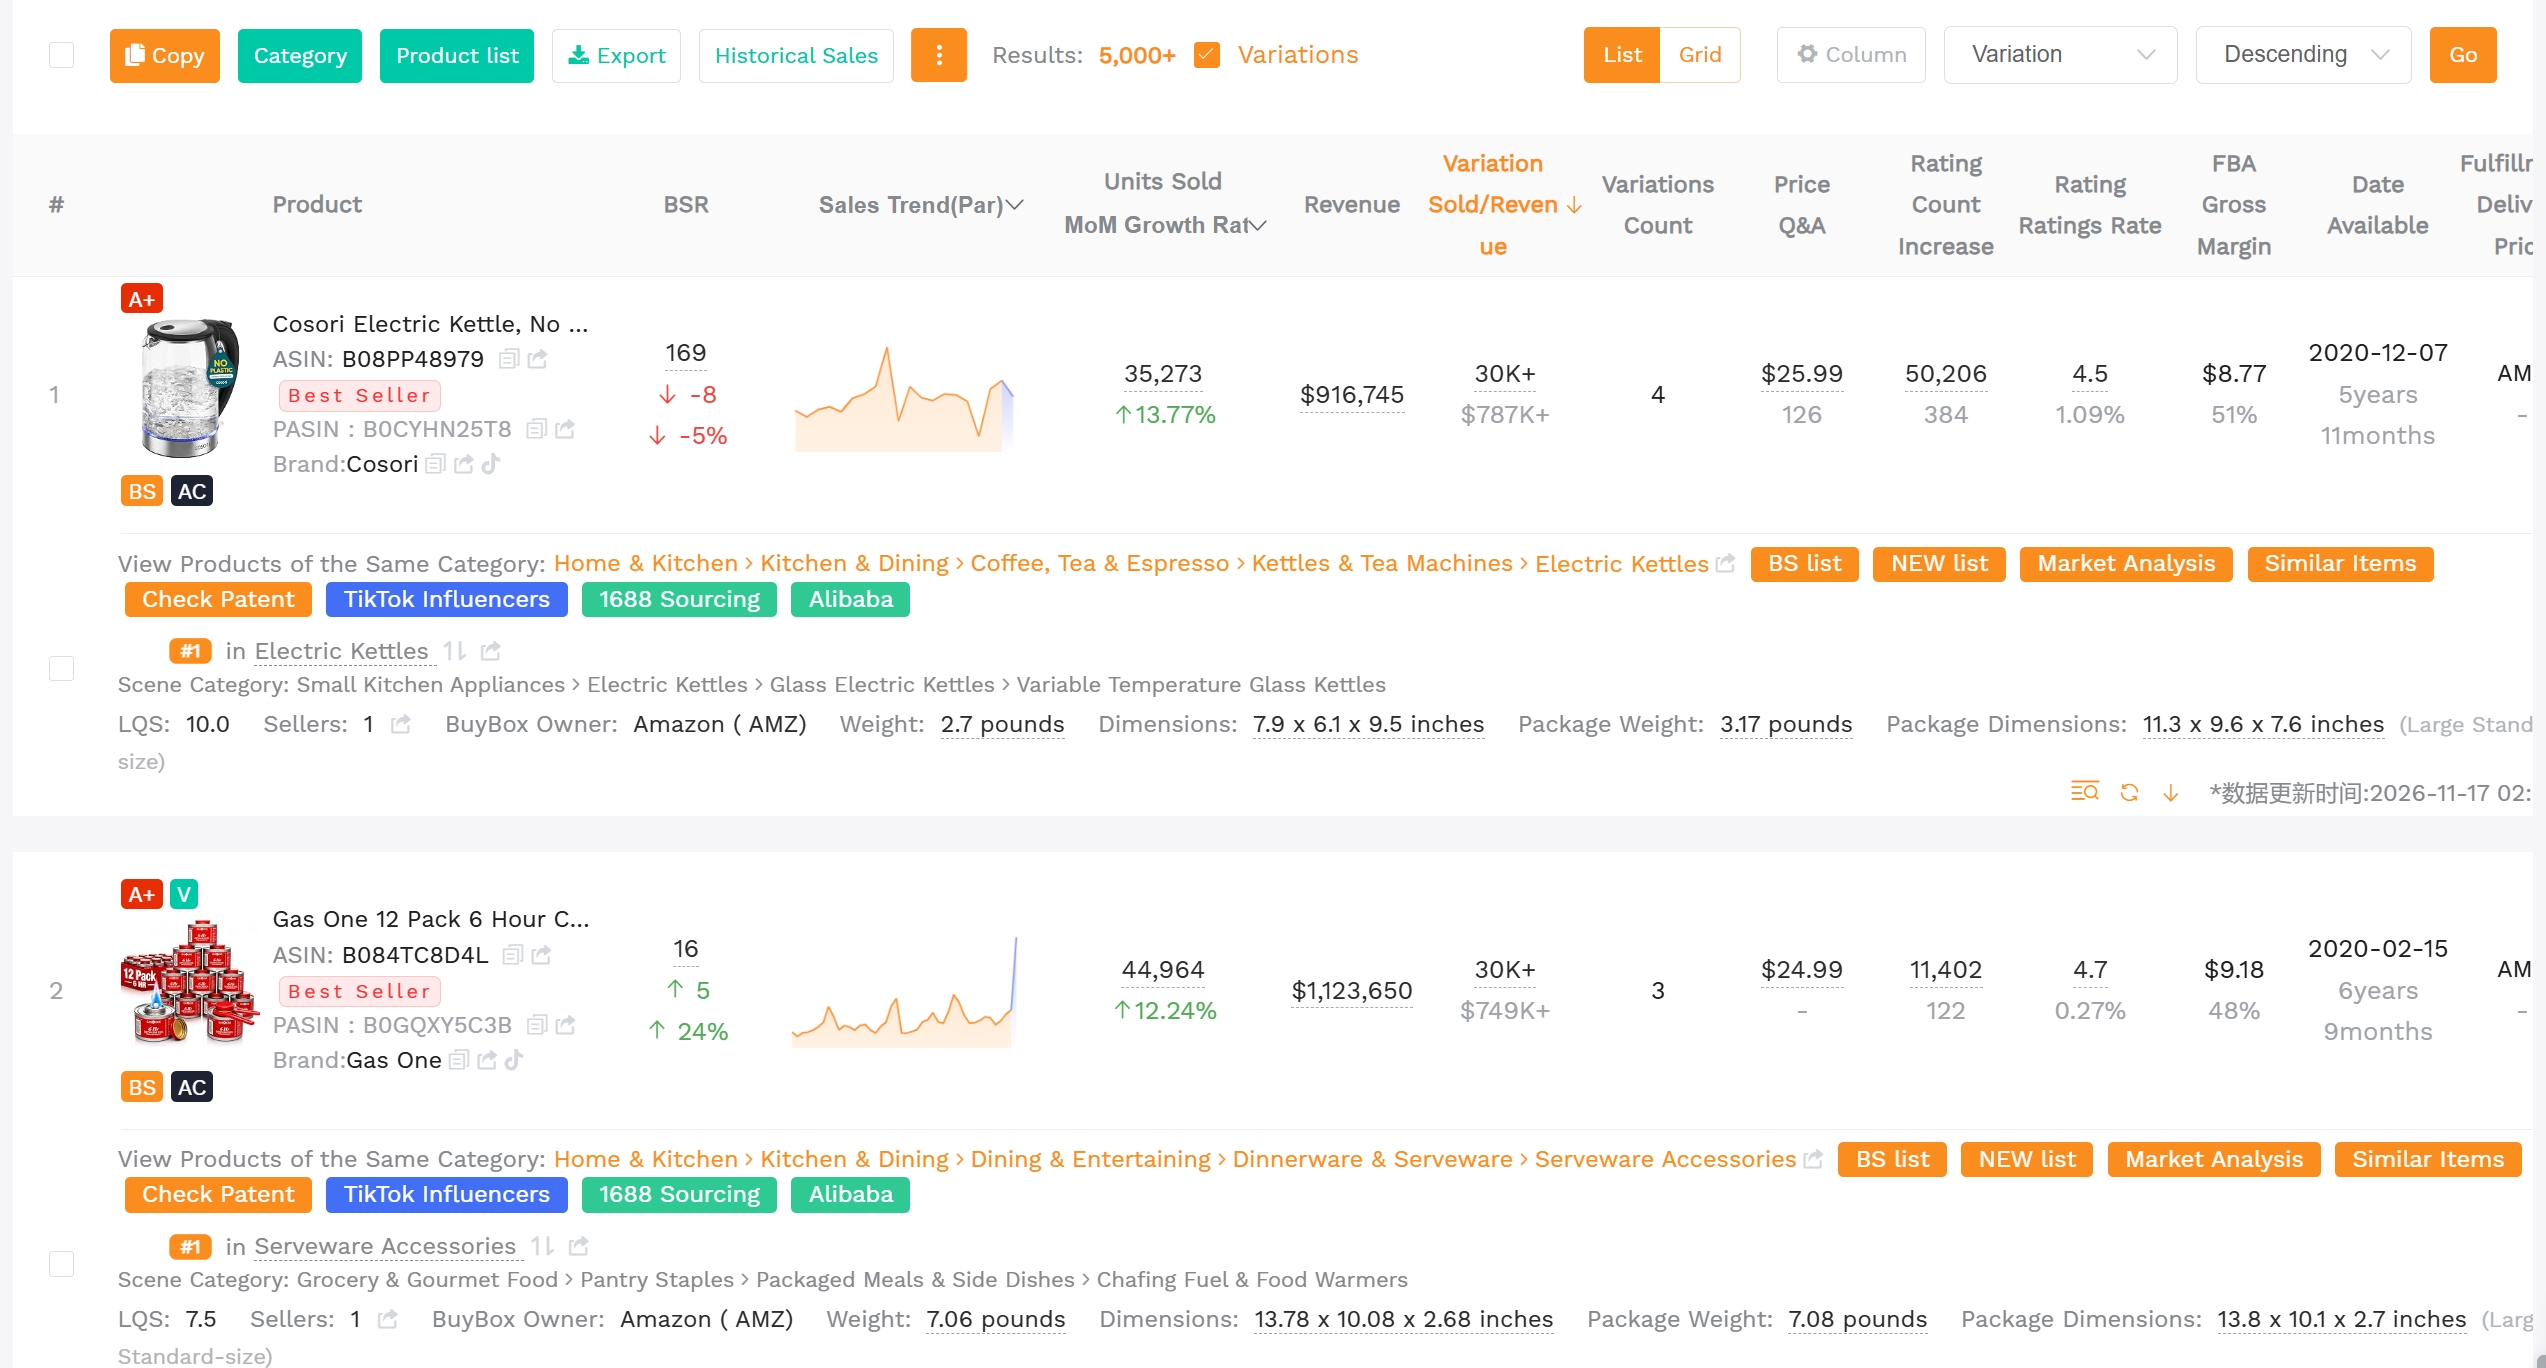
The comparison becomes far easier when both price bands are measured with the same data. SellerSprite's product research workspace lets you filter by category and price range, then compare demand, competition, and revenue estimates side by side. If you want the complete workflow first, start with the Amazon product research guide and then apply the steps below.
Compare Price Segments Within the Same Amazon Category
Focus on a single category, then divide the results into different price ranges, such as products priced under $25 and those priced above $100. Compare unit sales, revenue, review counts, and seller concentration in each band. If the upper band is dominated by two brands with thousands of reviews while the lower band is fragmented, that is a strong signal about where a new seller can realistically compete.
Analyze Historical Sales, Revenue, and Pricing Trends Before Choosing a Segment
Seasonality and price erosion look very different depending on the band. Check twelve-month trends: are prices in the low band declining steadily? Is the high band growing while the low band is flat? A segment with shrinking prices usually signals margin compression ahead, regardless of how healthy today's revenue looks on a snapshot chart.
Evaluate Keyword Demand, Competition, and Customer Purchase Intent
High-ticket keywords often show lower search volume but stronger purchase intent and higher conversion, while low-ticket keywords show high volume with heavy price comparison. Compare the keyword pools for both bands inside one category and look at how specific the long-tail queries are. Detailed, specification-heavy queries usually indicate a considered purchase where evidence wins the sale.
Use Customer Reviews to Understand What Justifies a Higher Price
Read the negative reviews in the premium band; they reveal what customers expected and did not get. Those gaps are your differentiation opportunities. Reviews also show which features buyers mention when they justify a purchase, which is exactly the evidence your listing must present if you choose the high-ticket route. Mine the language, then reuse it in your bullets and A+ content.
Validate the Final Economics With Amazon's Revenue Calculator
Once you have a shortlist, evaluate every candidate using Amazon's official Revenue Calculator with actual dimensions, weight, and cost of goods. Compare contribution profit per order, break-even ACoS, and the number of orders needed to reach your profit target. Then cross-check these calculations against SellerSprite's estimated sales data. Any product that is only profitable under overly optimistic assumptions should be rejected before you commit to inventory.
Final Verdict: Is High Ticket or Low Ticket Better for Amazon Sellers?
There is no universal winner in the high ticket vs. low ticket debate, but there is a clear decision rule: choose the model whose economics survive realistic assumptions about ads, returns, and cash recovery. If you cannot explain how a product would remain profitable with advertising costs increasing by 20% and the return rate rising by two percentage points, its profitability is not sustainable. The product may simply not have encountered the conditions that would expose its weaknesses.
Choose Low-Ticket When Repeat Demand, Fast Turnover, and Cost Efficiency Drive Profit
Low ticket wins when you have a sourcing advantage, replenishable demand, and the discipline to protect a thin margin. It rewards sellers who excel at logistics, ranking, and repeat purchase. If your strength is process rather than brand storytelling, a fast-turnover low-ticket line can generate consistent cash with far less inventory risk per SKU and a much shorter learning loop.
Choose High-Ticket When Differentiation and Contribution Profit Justify the Investment
High ticket wins when you can build genuine differentiation, present credible evidence, and afford the acquisition cost of a considered purchase. It rewards sellers with strong content, review management, and after-sales capability. If your strength is brand building and premium positioning, the higher contribution per order funds exactly the trust-building work the category demands from you.
Reject Either Model When the Economics Only Work Under Ideal Conditions
Reject a product if its profit depends on zero returns, a stable ad market, an unbroken supply chain, or a permanently low CPC. Stress-test every candidate: raise advertising cost 30%, add two points to the return rate, add fifteen days to lead time. If contribution still looks acceptable, you have a business. Otherwise, all you have is a spreadsheet, and a spreadsheet alone cannot generate the cash needed to pay for inventory.
FAQ
What Is Considered a High-Ticket Product on Amazon?
Most sellers treat anything above roughly $100–$200 as high ticket, but the label is relative to the category and the buyer's reference price. A better test is whether the purchase requires research and justification: if shoppers compare specifications, read negative reviews first, and expect a warranty, you are selling high ticket regardless of the exact number.
Are High-Ticket Products More Profitable Than Low-Ticket Products?
Not automatically. High-ticket products usually generate more contribution profit per order, which makes them easier to advertise profitably and faster to reach a revenue target. But they also carry larger inventory investment, higher return costs, and slower turnover. Profitability depends on contribution after fees, returns, and advertising, rather than on the price tag itself.
Are Low-Ticket Products Better for Amazon FBA Beginners?
Often yes, because launch cost is lower and mistakes are cheaper. A small test order on a low-priced item lets a new seller learn sourcing, listing, PPC, and restocking without risking the whole budget. The caveat is that thin margins leave little room for error once you try to scale, so plan the upgrade path early.
Do High-Ticket Products Have Lower Conversion Rates?
Generally, yes. High-ticket products tend to have lower conversion rates than impulse purchases because customers typically spend more time evaluating expensive items before buying. However, the difference is often smaller than sellers expect when a listing provides compelling evidence of product value and quality. A lower conversion rate is not necessarily a disadvantage if the contribution profit per order is sufficient to cover the resulting customer acquisition cost.
How Much Should I Spend on PPC for a High-Ticket Product?
Work backward from your economics: maximum affordable CPC ≈ contribution profit per order before ads × conversion rate. If you earn $60 contribution and convert at 8%, about $4.80 per click is your ceiling. Treat that as a ceiling, not a target, and set a per-SKU ACoS goal that still leaves profit after advertising.
Can I Sell Both High-Ticket and Low-Ticket Products on Amazon?
Yes, and many established sellers do. A common structure is a small number of high-ticket hero products that generate disproportionate profit, supported by fast-turnover low-ticket items that keep cash moving. The risk is operational complexity, so keep the portfolio small and evaluate every SKU with the same unit-economics model.
Next Steps
- Pick one Amazon category you already understand and split it into a low price band and a high price band.
- Build the full cost stack for two representative products, covering referral fee, fulfillment fee, storage, returns, and cost of goods, and then compare contribution per order and orders needed to hit your profit target.
- Calculate maximum affordable CPC and break-even ACoS for each, and check both against current bid levels in the niche.
- Run the cash-flow test: months to recover your first order's investment at realistic, not optimistic, sales velocity.
- Validate the shortlist in SellerSprite Product Research using price-segment filters, then confirm fees with Amazon's official calculator.
- Ready to run the numbers on your own candidates? Create a free SellerSprite account and start comparing price bands today.
References
- Amazon — Selling fees and referral fee rates (verify current percentages and minimums before pricing) View
- Amazon — Fulfillment by Amazon features and fulfillment fee structure View
- Amazon — FBA Revenue Calculator for validating unit economics View
- Amazon Ads — Sponsored Products for cost-per-click and ACoS planning View
- SellerSprite — Amazon Product Research Guide View
- SellerSprite — Product Research tool for price-segment comparison View
By SellerSprite Success Team
The SellerSprite Success Team combines deep Amazon marketplace expertise with data science to help sellers grow profitably. With years of experience in e-commerce analytics, we focus on ethical, sustainable strategies that align with Amazon's evolving algorithms and policies. Our insights are trusted by thousands of sellers worldwide.
Last updated: 2026-11-17