TL;DR: Using an Amazon PPC revenue calculator is the only way to see whether your ad spend is actually generating profit, not just revenue. This guide breaks down break‑even ACoS, TACoS, and how to integrate PPC costs into a full profit calculator. You'll learn to model launch‑phase vs. evergreen spending, read profitability metrics after launch, and avoid the hidden trap of ignoring ads when forecasting product profitability.
Key Takeaways
- An Amazon PPC revenue calculator must include ad spend per unit to reveal true profit after returns, fees, and advertising costs.
- Break‑even ACoS is the maximum you can spend before a sale becomes unprofitable, which is a critical guardrail for launch campaigns.
- Separating launch‑phase ads from evergreen campaigns prevents overspending that erodes margins once the listing matures.
- Tracking organic sales share and campaign‑level ACoS/TACoS post‑launch guides when to reduce ad reliance and boost net margin.
Table of Contents
Note on marketplaces: This guide is specifically optimized for the US market (Amazon.com). All formulas use US dollars, Amazon.com fee structures, and US‑typical conversion rates.
Quick Answer
Yes, you absolutely must include Amazon PPC ads when calculating real profit because revenue minus production, FBA fees, and ad spend is the only number that matters for your bank account. A dedicated Amazon PPC revenue calculator (sometimes called an Amazon PPC calculator or break even ACoS calculator) automatically subtracts cost‑per‑click from each sale to show net margin. Simply ignoring PPC while forecasting revenue from a spreadsheet often leads sellers to overestimate profitability by 20‑40%. The moment you turn on Sponsored Products, your "estimated profit" transforms into a guess unless you track ACoS and TACoS, the two metrics that reveal whether your ads are fueling growth or dragging you toward a loss.
Quick Definition: Break‑even ACoS = (profit per unit before advertising ÷ product price) × 100. If your pre‑ad profit is $10 and the price is $30, your break‑even ACoS is 33.3%. Spend more than 33.3% of the sale price on ads, and you lose money on that sale.
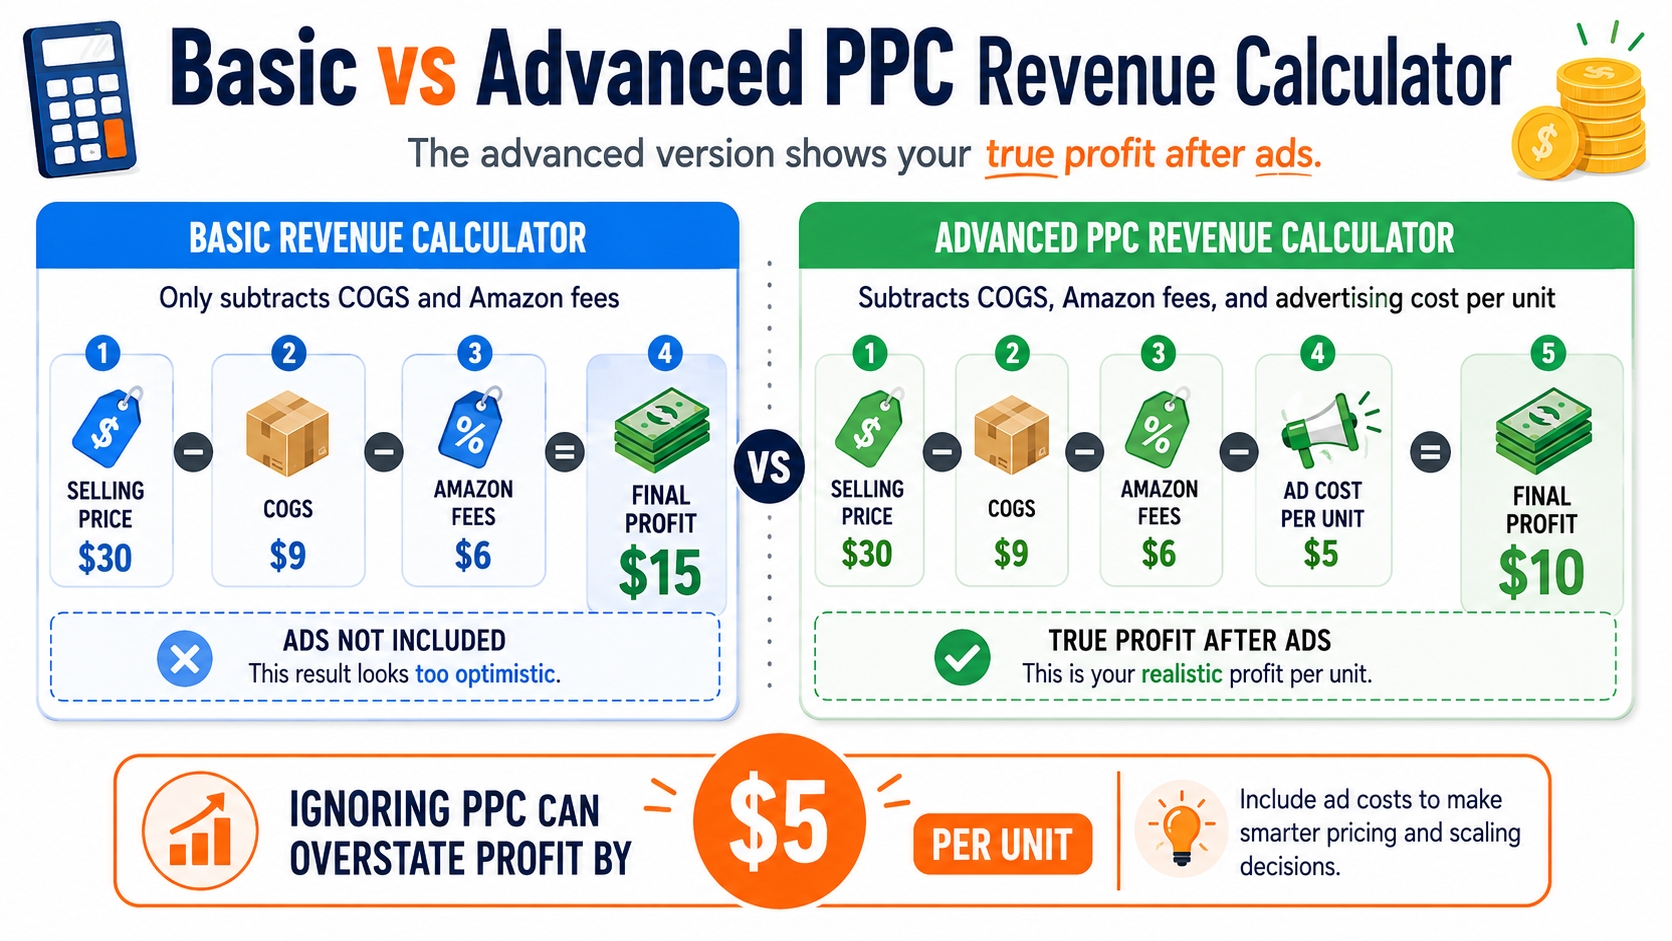
Ads must be included in real profit calculations
When Amazon sellers run a standard revenue calculator, they often input selling price, cost of goods sold, and FBA fees, and stop there. That number is contribution margin before advertising, not net profit. Once you launch Sponsored Products, the actual cost per sale includes CPC × clicks. For a $25 product with a 15% pre‑ad margin, a single conversion costing $4 in ads wipes out half of that margin. Many successful sellers treat advertising as a variable cost line, just like FBA fees, and only claim profitability after subtracting that cost. A true Amazon PPC profit calculator builds ad cost per order into the unit‑economics formula, giving you the clarity needed to set responsible ACoS targets.
PPC Metrics That Affect Revenue Calculations
To build an accurate Amazon PPC revenue calculator, you must understand the four metrics that translate raw ad spend into profit impact. Each plays a distinct role, and missing one can send your break‑even ACoS into dangerous territory. Below we walk through ACoS, TACoS, CPC, and conversion rate, then show you the break‑even formula that ties them all together.
ACoS
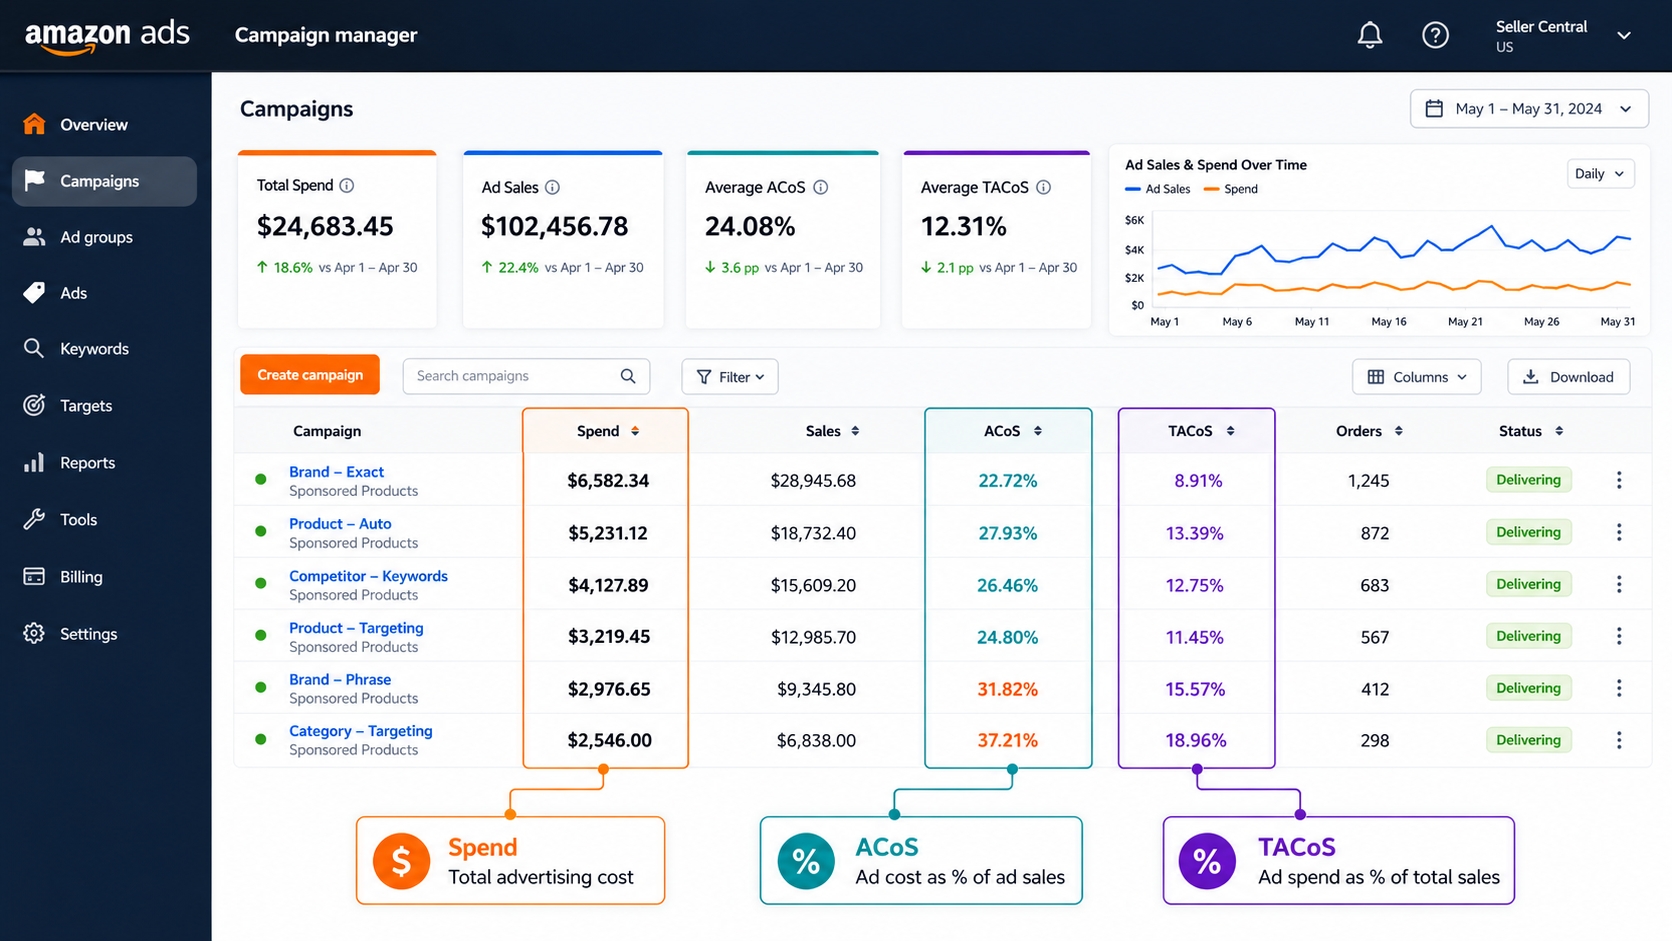
ACoS (Advertising Cost of Sales) = ad spend ÷ attributed sales × 100. It measures the efficiency of your Sponsored Products campaigns at the keyword or ad group level. For example, if you spend $50 and generate $200 in direct ad sales, your ACoS is 25%. A low ACoS generally signals a profitable campaign, but the real question is: how does that number compare to your product's pre‑ad margin? If your margin is 30%, an ACoS of 25% means you're still making money on those ad‑attributed orders. Many sellers use an ACoS target tied to their break‑even point, often called their "break‑even ACoS."
Pro Tip: Always calculate ACoS using attributed sales from the Advertising Console, not blended organic+ad sales. That's the number Amazon reports for each campaign, and it's the only way to gauge true ad efficiency.
TACoS
TACoS (Total Advertising Cost of Sales) = ad spend ÷ total sales (organic + ad) × 100. This metric reveals how dependent your entire product is on advertising. A high TACoS (say, over 30%) means ad spend is eating into organic revenue and your business may be over‑reliant on PPC orders. On the other hand, a falling TACoS as organic rank improves is a sign that your launch strategy is working. When using a PPC profit calculator, you often encounter TACoS in the post‑launch phase when you want to track it alongside ACoS to decide when to scale back ad spend. For a deep dive on the relationship between these two metrics, see our ACoS vs. TACoS article.
CPC
Cost‑per‑click (CPC) is the price you pay each time a shopper clicks on your ad. On Amazon, CPCs vary widely by category, from $0.50 in a low‑competition niche to over $5 for high‑demand keywords like "wireless earbuds." Because CPC directly multiplies with clicks to form your total ad spend, even a modest increase in average CPC can swing your break‑even ACoS considerably. When building a break even ACoS calculator, you need a realistic average CPC estimate; historical data from Amazon Campaign Manager or tools like SellerSprite's keyword research can provide ranges. Always use a conservative CPC estimate in your initial model to avoid over‑promising profitability.
Conversion rate
Conversion rate (CVR) is the percentage of clicks that become a sale. A 10% CVR means you need 10 clicks to get 1 order, so ad cost per order = CPC ÷ CVR. For example, with a CPC of $0.80 and a CVR of 8%, your cost per order = $0.80 ÷ 0.08 = $10. If your product sells for $30 and your pre‑ad margin is $12, that $10 ad cost erodes almost all your profit. This is why Amazon PPC revenue calculators must incorporate both CVR and CPC to predict true profit after ads. Improving your listing (pictures, reviews, A+ Content) can lift CVR and lower the CPA dramatically, which is often the highest‑ROI lever you can pull.
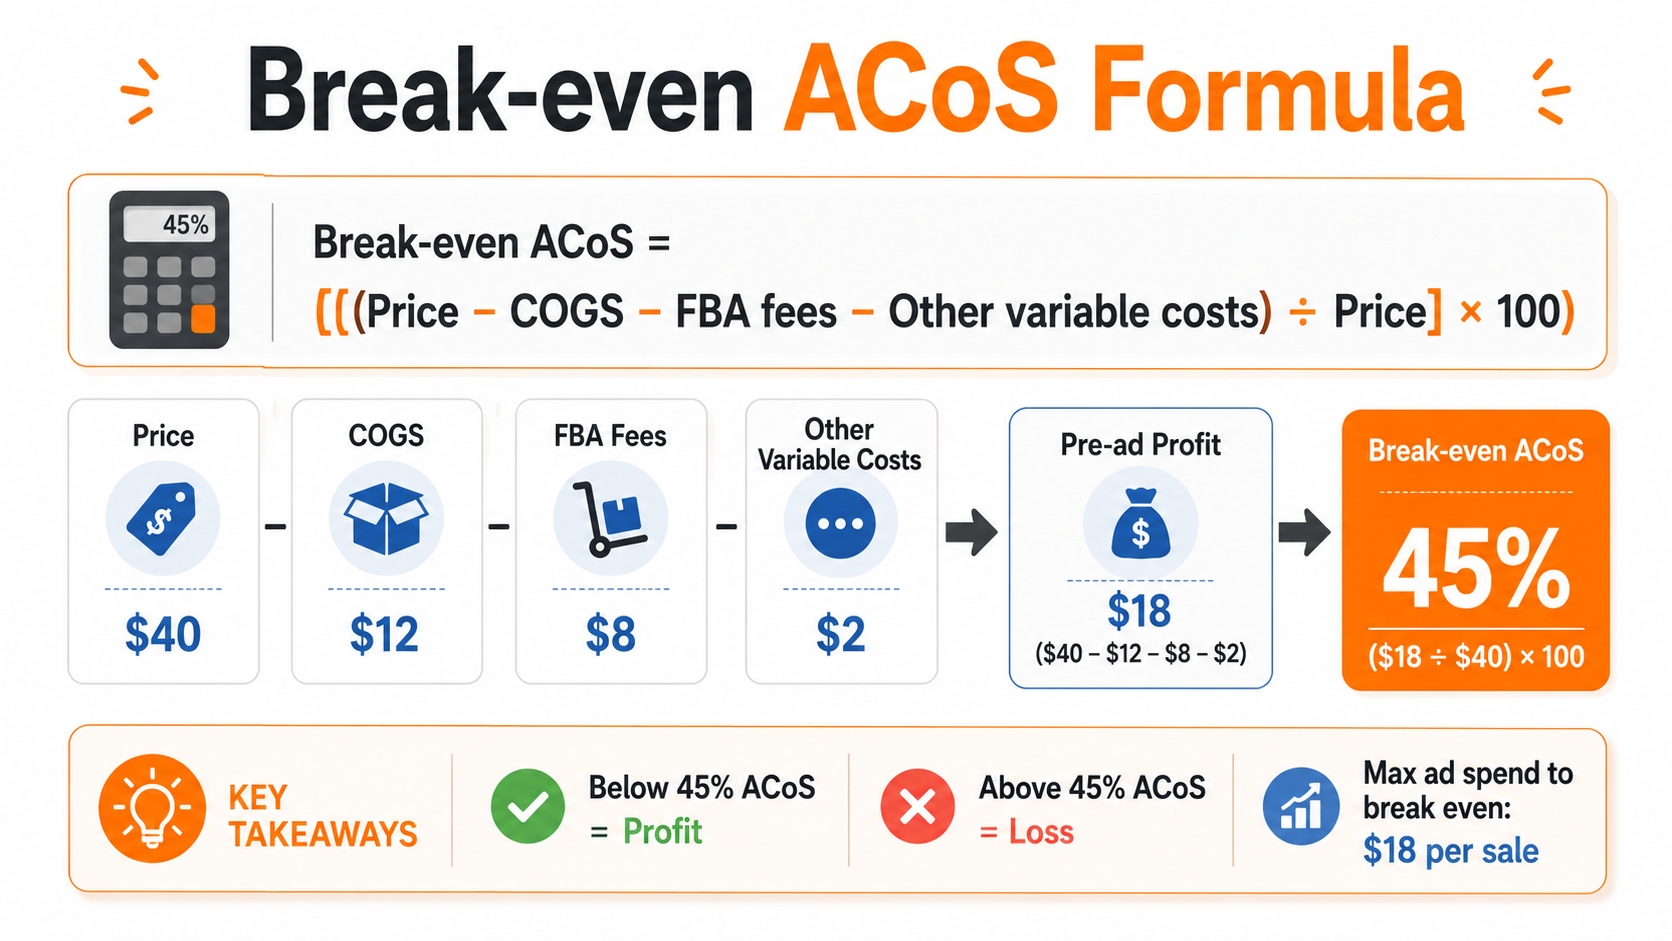
Break-even ACoS formula
Break‑even ACoS = ([(Price – COGS – FBA fees – Other variable costs) ÷ Price] × 100). In plain English, it's your pre‑ad profit margin expressed as a percentage of the selling price. If your product sells for $40, COGS is $12, FBA fees total $8, and you have $2 in other variable costs, then pre‑ad profit = $18, and break‑even ACoS = ($18 ÷ $40) × 100 = 45%. This means you can spend up to 45% of the sale price on advertising (i.e., up to $18 per sale) and still break even. Any ACoS target below this number results in profit; above it, you lose money on every ad‑driven order. Always use a comprehensive FBA fee calculation to ensure your break‑even ACoS is accurate.
How to Add PPC Cost to a Revenue Calculator
Integrating PPC costs into your Amazon revenue calculator turns a rough estimate into a realistic profit forecast. You have two main approaches: (1) a dedicated online Amazon PPC calculator that factors ad spend per unit, or (2) a spreadsheet where you model ad cost as a variable line. Either way, you must estimate ad cost per unit, separate launch vs. evergreen budgets, and model the organic uplift conservatively. Let's break each step down.
Estimate ad cost per unit
Start with a target ACoS or a forecasted CPC and CVR. For a new product, assume a moderate CVR (8–10% in most categories) and an average CPC. Then ad cost per unit = (CPC ÷ CVR). If your CPC is $0.70 and CVR is 10%, you'll pay $7 per order in ads. Multiply that by your planned ad sales volume to get total ad spend. Use this per‑unit figure in your PPC profit calculator spreadsheet. For a more precise estimate, you can pull average CPCs from a keyword research tool or Amazon's Campaign Manager bidding suggestions. Remember, this is a forecast, which means actual performance will vary, so build in a 10–15% buffer.
Separate launch ads from evergreen ads
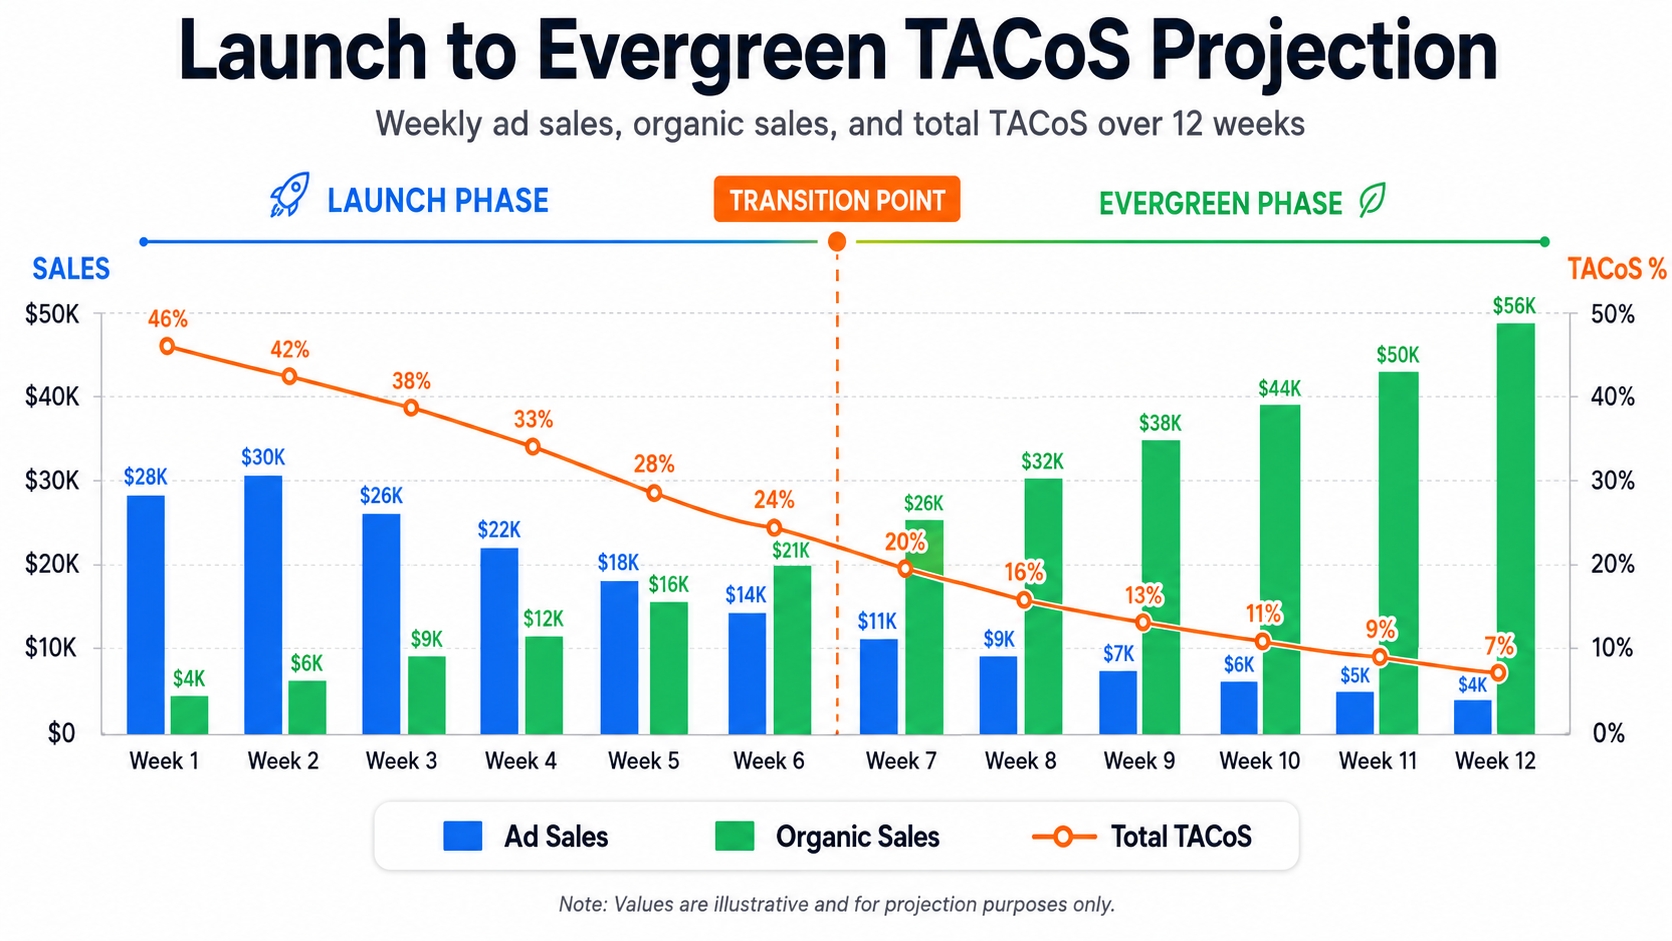
During a product launch, your goal is ranking velocity, not immediate profit. You might be willing to spend at or above your break‑even ACoS, even run at a small loss for a few weeks, because the organic rank lift will pay back later. But that's a strategic decision, not a permanent one. In your calculator, create two distinct phases: a launch phase (weeks 1–6) with a higher ACoS target, and an evergreen phase (from week 7 onward) where you aim for a lower, sustainable ACoS that maintains rank while returning healthy margins. A common mistake is to model the launch ACoS into perpetuity, which makes the product look unprofitable and leads sellers to abandon a viable launch. Mark the transition date clearly in your forecast.
Checklist: Launch vs. Evergreen Ad Budget
☐ Define launch duration (e.g., 4–6 weeks)
☐ Set launch ACoS target (e.g., break‑even + 10%)
☐ Forecast weekly ad spend based on planned orders
☐ Determine the evergreen ACoS you need to sustain organic rank
☐ Set a clear date to switch budgets and actually do it
Model organic lift conservatively
One of the trickiest parts of an Amazon PPC revenue calculator is predicting how much organic sales will grow while you spend on ads. Over‑optimism can lead to overspending. A prudent approach: assume that after the first 4–6 weeks of aggressive ad spend, organic sales will rise by about 50% of the ad sales volume during launch. For example, if you generate 100 ad sales per week during launch, expect an additional 50 organic sales per week by week 8. This organic lift gradually reduces your TACoS, even if ACoS remains high. Use a conservative ramp‑up factor (0.3–0.5 of ad sales) in your calculator and validate with actual data once live. Adjust your ad spend up or down based on real‑world keyword rankings.
Break-Even Scenarios
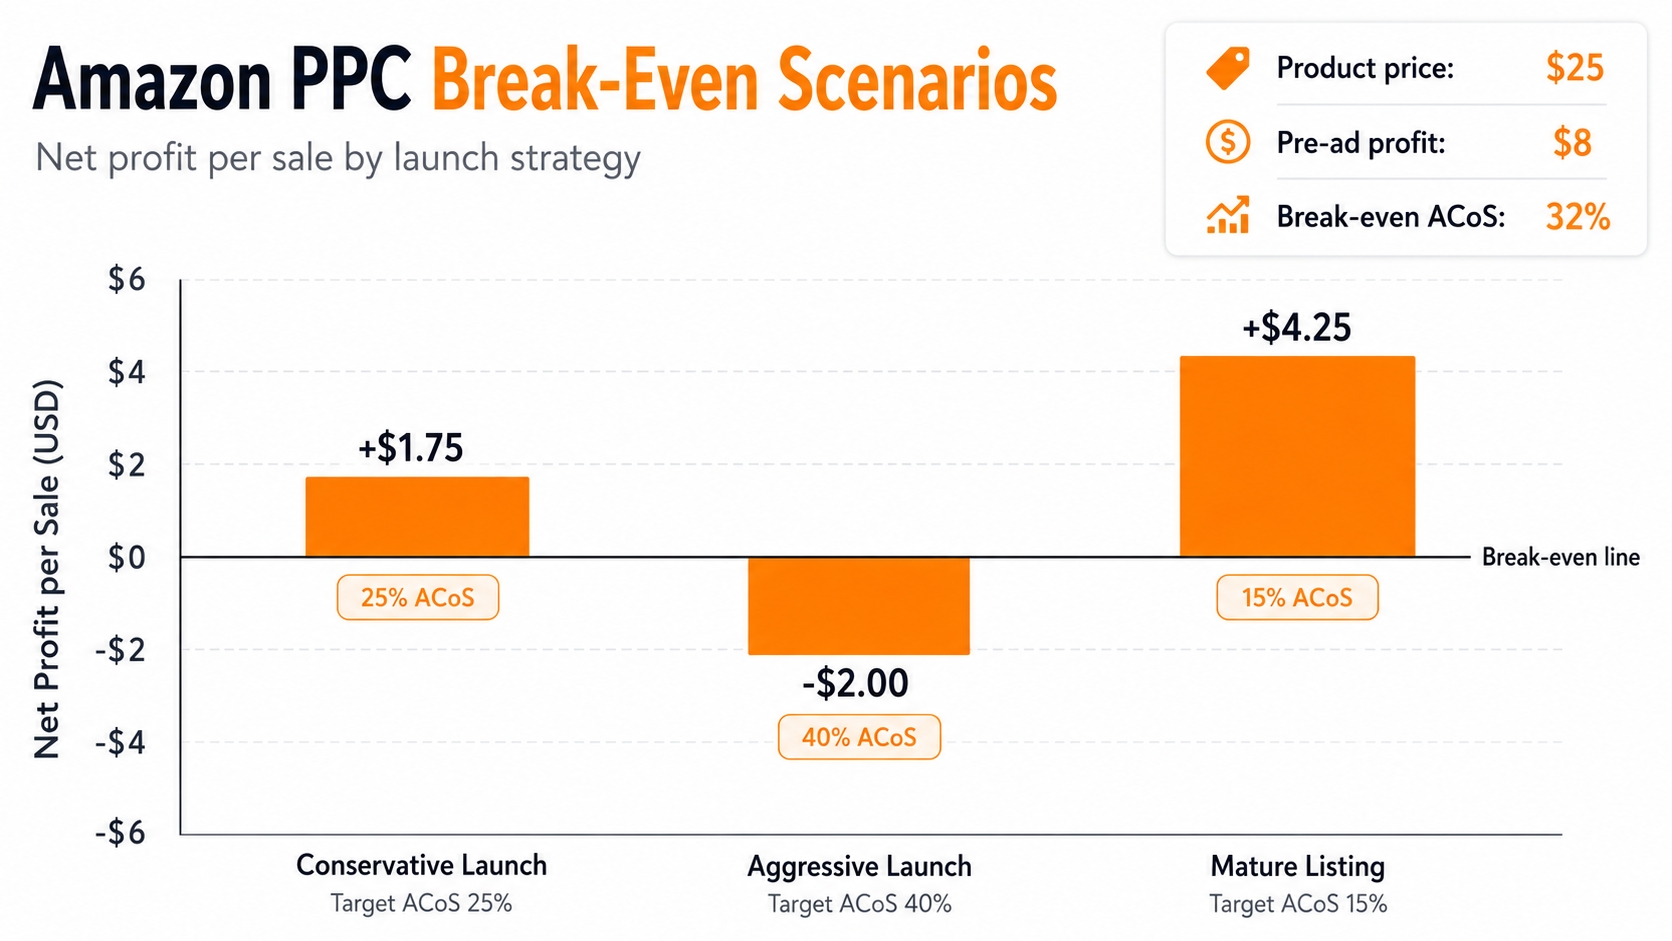
Different stages of a product's lifecycle demand different break‑even calculations. What's acceptable during an aggressive launch isn't sustainable in a mature listing. Below we examine three real‑world scenarios using a $25 product with pre‑ad profit of $8 (32% margin). We'll walk through a conservative launch, an aggressive launch, and a mature listing, then show a comparison table to help you choose the right ACoS target.
Conservative launch
A seller with limited cash flow might decide never to lose money on a sale. Their break‑even ACoS is 32%. They set an ACoS target of 25%, leaving a 7% net margin. This means for every $100 in ad sales, they spend $25 on ads, retain $7 profit. The launch will be slower because they underbid on high‑traffic keywords, but the unit economics stay safe. Over time, organic rank improves gradually; after 12 weeks they may see consistent 7–10% profit margins while slowly scaling back ad spend. This strategy works in niches with low competition and reasonable CPCs. It's the preferred approach for cash‑strapped sellers or those testing a product's viability before scaling.
Aggressive launch
A well‑capitalized brand might target a 40% ACoS during the first 6 weeks, intentionally operating at a small loss (since break‑even is 32%). They know that rapid keyword ranking and reviews will later drive organic sales that offset the initial cash burn. In weeks 1–6, they absorb a loss of $2 per sale (8% negative margin at 40% ACoS). By week 8, organic sales skyrocket, TACoS drops to below 20%, and the blended net margin turns positive. This scenario requires careful monitoring: if ACoS doesn't drop on schedule, you must pull the plug. Use a PPC profit calculator to model the cash burn and set a hard stop if targeted rank isn't achieved.
Mature listing
Once a product has a stable Best Sellers Rank and high organic volume, ad spend is maintained only to defend top positions. The target ACoS is set far below break‑even (say, 15%), so that ad‑attributed sales contribute a healthy 17% net margin. The seller monitors TACoS closely; if it creeps above 15–20%, they trim underperforming keywords and reallocate budget to exact‑match terms. At this stage, the Amazon ACoS calculator serves as a guardrail: any campaign whose ACoS exceeds break‑even for more than a few days gets paused. Most 7‑figure sellers operate with an evergreen ACoS in the single digits to low teens.
Scenario comparison table
The table below summarizes the key numbers for each scenario using our $25 product example. Use it as a quick reference when setting your Amazon PPC revenue calculator targets.
| Scenario | Break‑Even ACoS | Target ACoS | Net Margin per Sale | Typical Duration |
|---|---|---|---|---|
| Conservative Launch | 32% | 25% | $1.75 (7%) | 8–12 weeks |
| Aggressive Launch | 32% | 40% | ‑$2.00 (‑8%) | 4–6 weeks |
| Mature Listing | 32% | 15% | $4.25 (17%) | Ongoing |
Always plug your own product's numbers into an Amazon PPC profit calculator to see which path fits your budget. And remember, the aggressive launch only works if organic rank actually follows.
What to Track After Launch
Launching your ads is only half the battle. You need a disciplined post‑launch monitoring routine to ensure that spend aligns with profitability goals. Here are the three non‑negotiable metrics to track, along with actionable thresholds.
Keyword ranking
Check the organic and sponsored positions of your top 10–15 target keywords weekly. If you've invested heavily in an aggressive launch but those keywords aren't moving out of page 3 within 6 weeks, your ads aren't driving enough conversion velocity to boost rank. Tools like SellerSprite's keyword tracker can help you follow keyword position changes. When rank stalls, reassess your bid strategy, listing content, and review count before burning more ad dollars. A related tactic: use exact‑match campaigns for your highest‑intent keywords, even if CPCs are higher, because they often produce stronger ranking signals than broad match.
Organic sales share
Organic sales share = organic orders ÷ total orders. As a rule of thumb, you want organic share to exceed 50% by month 3. If after 90 days you're still driving 70%+ of sales through PPC, your product may be at risk when you eventually cut ad spend. Track this metric in your Amazon PPC revenue calculator dashboard. A declining organic share should trigger a deep dive into your conversion rate and keyword ranking progress. Sometimes a simple listing optimization, such as enhanced images or better bullet points, can lift organic share by single‑digit percentage points.
Campaign profitability
Assess each campaign's ACoS against your break‑even ACoS weekly. Campaigns that exceed break‑even for two consecutive weeks should be paused or restructured. Additionally, keep an eye on TACoS at the parent ASIN level because this is where the Amazon TACoS calculator comes in. A TACoS above 25–30% often indicates over‑reliance on ads. Use that signal to reduce bids on high‑ACoS keywords, shift budget to profitable long‑tail terms, or test lower‑cost automatic campaigns. Remember: a campaign can be "unprofitable" by ACoS but still worth running if it's driving significant organic sales. So, always verify before pausing entirely.
FAQ
How to calculate profit after Amazon PPC ads?
Calculate net profit by subtracting all costs including COGS, FBA fees, and ad spend per unit from the selling price. Use an Amazon PPC profit calculator or a spreadsheet that includes ad cost per unit (CPC ÷ conversion rate). For example: Price $40 – COGS $12 – FBA fees $8 – Ad cost $6 = $14 net profit. Monitor ACoS and TACoS to ensure campaigns remain above break‑even.
What is break-even ACoS?
Break‑even ACoS is the maximum advertising cost of sales you can incur before a sale becomes unprofitable. Formula: (Profit per unit before advertising ÷ Product price) × 100. If your pre‑ad profit is $8 and price is $25, break‑even ACoS = 32%. Any ACoS below that generates profit; above it loses money.
What is the difference between ACoS and TACoS?
ACoS = ad spend ÷ attributed ad sales. TACoS = ad spend ÷ total sales (organic + ad). ACoS tells you the efficiency of one campaign; TACoS shows how your entire product's revenue depends on advertising. A falling TACoS as organic sales grow is the sign of a successful launch strategy.
Can a high ACoS be acceptable during a product launch?
Yes, an ACoS above break‑even (even a negative margin) can be acceptable for 4–6 weeks if you're investing in ranking velocity. The goal is to rapidly gain keyword positions that will drive future organic sales. However, you must have a hard stop and a plan to lower ACoS as the launch phase ends. Without an organic lift, sustained high ACoS will erode your capital.
How does conversion rate affect PPC profitability?
Conversion rate directly determines ad cost per sale: CPA = CPC ÷ CVR. A small improvement in CVR dramatically lowers CPA. For example, raising CVR from 5% to 7% with a $1 CPC reduces cost per sale from $20 to $14.28. Optimize your listing, images, reviews, and pricing to boost CVR, because it's the fastest way to increase PPC profitability without increasing bids.
Next Steps
- Plug your numbers into the free SellerSprite Amazon PPC Revenue Calculator to see your break‑even ACoS and profit scenarios instantly.
- Read our comprehensive Amazon Revenue Calculator Guide for a full walk‑through of product‑level profit forecasting.
- Audit one active Sponsored Products campaign this week, calculate its ACoS, compare it to your break‑even, and decide whether to optimize or pause.
References
- Amazon Advertising: Understand Advertising Cost of Sales (ACoS) View
- SellerSprite: ACoS vs. TACoS – Understanding Profitability Metrics View
- SellerSprite: Amazon FBA Fees Explained View
By SellerSprite Success Team
The SellerSprite Success Team comprises experienced Amazon sellers, PPC specialists, and e‑commerce analysts. With a deep command of Amazon advertising algorithms, fee structures, and financial modeling, the team creates practical, data‑backed content to help sellers of all sizes, from solo entrepreneurs to 7‑figure brands, build profitable Amazon businesses.