TL;DR: SellerSprite's Reverse ASIN tool answers the same research questions as Helium 10 Cerebro, but the labels, formulas, and data windows are not identical. This guide maps each familiar Cerebro metric to its closest SellerSprite field, flags where no verified one-to-one match exists, and gives you a filter workflow you can reuse on every export.
Key Takeaways
- Every core Cerebro question — demand, competition structure, ranking feasibility, and visibility — has a SellerSprite counterpart, but only some fields map cleanly (title density, organic rank, sponsored presence).
- Proprietary scores are not interchangeable: Cerebro IQ Score and SellerSprite's DSR measure related but different things, so thresholds must be re-tested rather than copied.
- CPR and SPR both estimate the sales velocity needed to rank, but they differ in target position, model, and ASIN scope. Treat them as feasibility signals, not launch-cost calculators.
- Reverse ASIN data is observational and estimated. It cannot reveal a competitor's exact orders or ad spend, so validate every shortlist with Search Query Performance and your own advertising reports.
- The durable asset is your filter logic, not a universal score cutoff. Save the logic and re-tune the numbers as data refreshes and categories change.
Table of Contents
- Start Here: Which Cerebro Metrics Can You Find in SellerSprite?
- Before You Compare Numbers, Check What Each Metric Measures
- Cerebro IQ Score vs. DSR: A Demand-to-Supply Signal, Not a Difficulty Grade
- CPR vs. SPR: An Eight-Day Sales Estimate Is Not a Ranking Guarantee
- Search Volume, Keyword Sales, and Purchase Rate: Demand Is Not Your Conversion Rate
- Title Density and ABA Concentration: Measure How Competition Is Structured
- Organic Rank, SP Rank, and Sponsored ASINs: Separate Presence From Performance
- Impr. Share and Keyword Distribution: Read SellerSprite's Percentage Metrics Correctly
- Three Keyword Profiles: How to Act When Metrics Disagree
- Move From Familiar Cerebro Filters to a SellerSprite Decision Workflow
- FAQ
- Next Steps
- References
Note on marketplaces: This guide is specifically optimized for the US market.
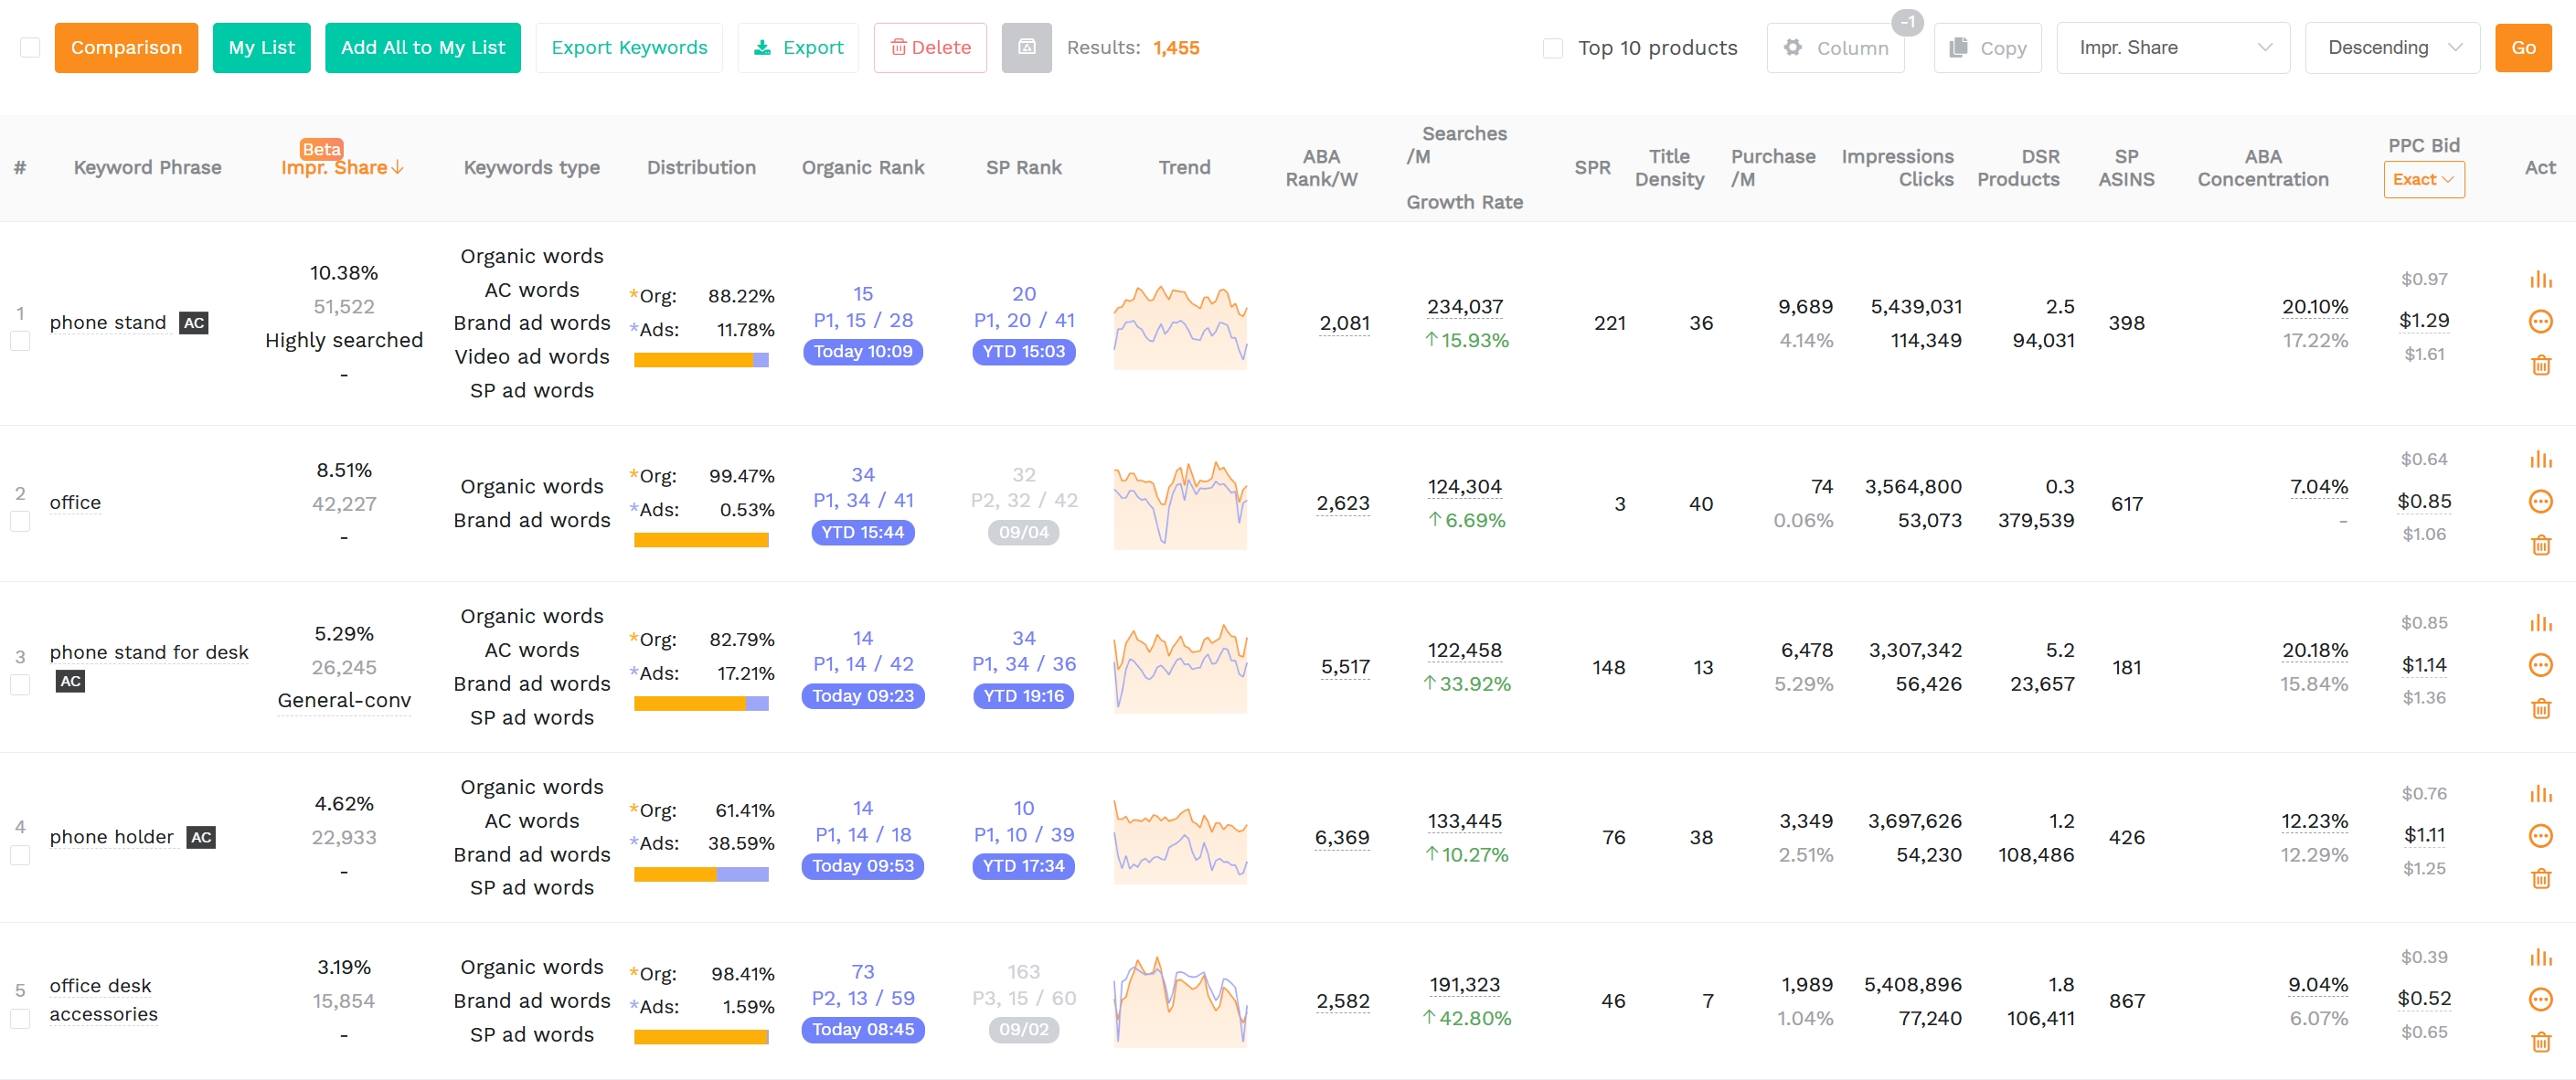
Most sellers who move from Helium 10 Cerebro to SellerSprite ask the same question first: which of my Cerebro columns actually exist over there? The honest answer is that the decisions are the same, the labels look similar, and the numbers are not interchangeable. SellerSprite's Reverse ASIN tool covers demand, competition structure, ranking feasibility, and visibility, but it expresses them through its own metric set, including search volume, DSR, SPR, title density, and percentage-based distribution fields.
This page is the translation layer. It maps each familiar Cerebro metric to its closest SellerSprite counterpart, marks the fields where no verified one-to-one equivalent exists, and finishes with a filter workflow you can run on any reverse ASIN export. If you want the underlying research methodology first — how reverse ASIN data feeds product selection and launch planning — read our reverse ASIN strategy guide before continuing.
Start Here: Which Cerebro Metrics Can You Find in SellerSprite?
The fastest way to migrate is to stop hunting for identical labels and start matching decisions instead. Cerebro was built to answer four practical questions: does this keyword have demand, how crowded is page one, what would it take to rank, and who is visible right now. SellerSprite's Reverse ASIN tool answers the same four questions using its own vocabulary. The table below works as a translation key, which you can use to find the right column, then read the three notes that follow before you trust any number in it.
| Familiar Cerebro field | Closest SellerSprite field | How close is the match? |
|---|---|---|
| Search Volume | Search Volume (monthly estimate) | Similar concept, different model and window |
| Cerebro IQ Score | DSR plus relevance and volume filters | Directional only as the formula differs |
| CPR | SPR | Same style of estimate, different target and model |
| Title Density | Title Density | Close match; verify collection and matching rules. |
| Organic Rank | Organic Rank | Close match; both are point-in-time snapshots |
| Sponsored ASINs | Sponsored ASINs | Close match; Check advertising-format coverage and observation windows. |
| Keyword Sales | Monthly purchases | Check units, scope, and time window |
| ABA Total Click Rate | ABA Concentration | Same metric |
Read the match-quality column, not the label. Metric definitions in both tools can change, so confirm the current wording in the in-app glossary before you build a rule on top of it.
Familiar Labels Can Hide Different Definitions
When two tools both publish a column called Search Volume, it is natural to assume the values should be close. They often are not, and that is not necessarily a bug. Each tool decides how to source, model, and smooth its estimates, which marketplace snapshot to use, how to handle low-volume terms, and how often to refresh. A shared label tells you the concept is shared; it does not tell you the denominator, the sample, or the update cadence. Before you compare two values, open both definitions and confirm they describe the same thing. Where they do not, treat the gap as measurement variance rather than a trading signal.
Proprietary Scores Need Related Metrics, Not Assumed Equivalents
Scores such as Cerebro IQ Score, DSR, and SPR are proprietary models, which means there is no published conversion factor between them and no honest way to say that one score equals another. The useful move is to translate the underlying comparison rather than the number. Ask what the score compares — demand against supply, required velocity against your capacity, visibility against the shelf — then rebuild that comparison from raw columns: search volume, listing counts, title density, keyword sales, and organic rank. Rebuild the judgment; do not port the score.
Some Cerebro Fields Have No Verified One-to-One Match
A few Cerebro metrics do not have a verified one-to-one equivalent in SellerSprite. In those cases, avoid forcing a mapping simply because two fields appear to support a similar decision. Some metrics use different data sources, formulas, time windows, or scopes, while other information, such as a competitor's exact ad spend or campaign budget, is private account data that third-party reverse ASIN tools cannot directly access. Instead of inventing an equivalent, identify the decision you are trying to make and use the most relevant observable signals together. For example, Sponsored Rank, Sponsored ASINs, PPC Bid, and historical movement can help assess paid-search pressure, but they cannot reveal a competitor's actual advertising budget. Treat these conclusions as directional inferences unless the underlying metric is directly verified.
Before You Compare Numbers, Check What Each Metric Measures
Before comparing any two figures, confirm they describe the same kind of thing. Most confusion in reverse ASIN research comes from three mismatches: level, type, and scope. A keyword-level demand estimate and an ASIN-level visibility metric belong to different questions. An observed position and a modeled volume carry different error profiles. Two identical labels can differ purely because one covers the US marketplace and the other covers the UK. Run the four checks below before you write a comparison into your notes.
Four checks before comparing two numbers
- Level: is the metric about the keyword market or about one ASIN's participation in it?
- Type: was it observed in a crawl, or estimated by a model?
- Scope: same marketplace, same window, same parent or child ASIN, same dedup rule?
- Definition: same units, same currency, same position basis (top of page vs. absolute slot)?
Keyword-Level Demand vs. ASIN-Level Visibility
Keyword-level metrics, such as search volume, keyword sales, and search-to-purchase rate, describe the market around a search term. ASIN-level metrics, such as organic rank, SP rank, Impr. Share, keyword distribution, describe how one listing participates in that market. Mixing them produces statements such as, this keyword has thousands of searches, so I will rank at position ten, which connects nothing to nothing. Keep the two layers in separate columns of your research file, and only combine them at the moment of a decision, not while you are still describing the data.
Observed Positions vs. Estimated Volumes and Model-Based Scores
Observed data is what a crawler saw at a specific time: the ranking position of an ASIN, the presence of sponsored placements, the number of listings with a term in the title. Estimated data is inferred: search volume, keyword sales, DSR, and SPR. Observed data is a snapshot that shifts with location, personalization, and variation; estimated data carries a model's error bars. Do not average the two together, and do not treat an estimate as a measurement. When a decision depends on a single number, ask which category it falls into first.
Match the Marketplace, Time Window, and Variation Scope
A US snapshot is not a DE snapshot, a 30-day window is not a 90-day window, and a parent ASIN is not the child variation that actually ranks. Before comparing a Cerebro figure with a SellerSprite figure, confirm four settings match: marketplace, time window, ASIN scope, and the aggregation rule for variations. When only three of the four align, the difference you are staring at may be configuration rather than data, and any conclusion you draw from it will be wrong for the right-looking reason.
Cerebro IQ Score vs. DSR: A Demand-to-Supply Signal, Not a Difficulty Grade
Cerebro IQ Score and SellerSprite's DSR are the two values most often treated as direct translations, and also the two most often misread. Neither is a difficulty grade in the way a review count is. Both compress a relationship between how much people search and how much competing product they are searching against, which makes them useful for sorting a long list quickly and dangerous for making a go or no-go call on their own.
What Each Metric Compares
Cerebro IQ Score blends several inputs, typically demand and competition signals, into one opportunity score used to sort keywords. SellerSprite's DSR is a demand-to-supply ratio that relates search demand to the supply of competing listings for that keyword, so a higher value generally means more searches chasing each competing unit. Because the inputs, weights, and normalization differ, the two scores are not interchangeable and there is no honest multiplier between them. Check the current in-app definition of each before you quote a threshold to your team.
Why High Ratios Can Hide Weak Relevance or Strong Incumbents
A high DSR feels like a green light, but it only tells you the arithmetic of demand and supply. If the keyword is irrelevant to your product, the traffic will arrive and never convert. If supply looks low because page one is dominated by two heavily reviewed brands, the ratio understates the real barrier to winning. Narrow filters can also shrink the supply count artificially and inflate the ratio. Always pair the ratio with a relevance check and a look at who actually occupies page one today.
Rebuild Filters Instead of Reusing Cerebro IQ Thresholds
If your saved Cerebro filter was an IQ Score cutoff, the equivalent is not a DSR cutoff. Rebuild the filter as a sequence: a relevance gate first, then a demand floor, then a competition ceiling using title density and DSR together, and finally a feasibility check with SPR. Calibrate each cutoff against keywords you already know convert for you in your category, then save that logic rather than a borrowed number. If you need the mechanics of running the query itself, our walkthrough on how to perform a reverse ASIN search covers the setup step by step.
CPR vs. SPR: An Eight-Day Sales Estimate Is Not a Ranking Guarantee
CPR and SPR are the closest pair in this entire mapping. Both try to express how much sales velocity a keyword appears to require before a listing can hold a page-one organic position. They are close enough to support the same decision and different enough that you should never quote one as the other, especially when a launch plan or a budget depends on the answer.
What CPR and SPR Are Designed to Estimate
CPR (Cerebro Product Rank) is Helium 10's estimate of the sales needed, often framed across an eight-day window, to reach top half of page one for a keyword. SellerSprite's SPR answers the similar question inside its own model, describing the eight-day sales volume associated with reaching a page one position. Both are derived from historical relationships between sales velocity and rank movement rather than from a controlled experiment, so both are estimates of relative effort, not guarantees. Confirm the current definition and target position in each tool before you build a plan on top of them.
Check the Target Position and Variation Scope Before Comparing Them
The same ASIN can show very different values for the same keyword if the tools define the goal differently, for example, top of page one versus a specific slot, or a push measured on the parent listing versus the child variation that actually ranks. Variation scope matters because reviews and rank concentrate on the child, while some tools aggregate to the family. Compare only figures computed on the same marketplace, the same keyword, the same ASIN scope, and a comparable target position. Otherwise you are comparing two different questions and calling it a discrepancy.
Use Sales Estimates to Assess Feasibility, Not Predict Exact Launch Costs
The most expensive mistake is converting CPR or SPR into a launch budget. These values rank keywords by relative difficulty, which is genuinely useful: if keyword A requires materially more velocity than keyword B, you now know where to start and what to postpone. They cannot tell you your total spend, because that depends on your conversion rate, price point, review base, and advertising efficiency, all of which belong to you, not to the market. Use the estimate to choose an order, then track your real cost per ranking position in your own reports.
| Check before comparing | Why it changes the number |
|---|---|
| Target position | Top of page one and mid-page one require different velocity |
| Parent vs. child ASIN | Reviews and rank concentrate on the child variation |
| Marketplace and window | Different demand pools and historic periods |
| Model version | Proprietary models are recalibrated over time |
Search Volume, Keyword Sales, and Purchase Rate: Demand Is Not Your Conversion Rate
Demand metrics are the easiest to quote and the easiest to misinterpret, because how many people searched for something and how many people bought it are different questions. SellerSprite reports several demand-related figures, Cerebro reports several others, and neither set is your conversion rate. Knowing which column answers which question is what keeps a keyword list from turning into an inventory mistake.
Monthly Searches vs. ABA Search Frequency Rank
Amazon Brand Analytics publishes a search frequency rank, which is ordinal: rank 1 is the most searched term in that period, and rank 40,000 is far less searched. It is not a volume, and gaps in rank do not map cleanly onto percentage gaps in demand. Modeled monthly search volumes are the practical alternative, but they are estimates that get smoothed, sampled, and refreshed. Use rank for direction and trend, use modeled volume for sizing, and always state which one you are quoting.
Keyword Sales vs. Monthly Purchases: Check Units, Scope, and Time Windows
Keyword sales and monthly purchases can look interchangeable and often are not. Check whether the figure counts units or orders, whether it covers a single ASIN or every listing on the results page, whether variations are merged, and which window it summarizes. A market-level monthly purchase number and a single-listing keyword sales number can differ by an order of magnitude for entirely legitimate reasons. Write the unit and the scope next to the number in your notes; it will save you from a bad reorder later.
Search-to-Purchase Rate vs. Click-to-Purchase Conversion
Search-to-purchase rate divides market purchases by market searches for a keyword, which tells you how commercially intent-driven that term is. Your conversion rate divides purchases by clicks or sessions on your listing, which tells you how well your detail page converts the traffic it receives. Same word, different denominators. A keyword with an excellent search-to-purchase rate can still convert poorly for you if price, packaging, imagery, or review depth miss the underlying intent.
Why Market-Level Purchases Do Not Reveal a Competitor's Orders
Aggregate keyword purchases describe an entire market, not one seller. No reverse ASIN tool observes a competitor's order count, conversion rate, or ad spend, because those figures live inside the seller's account. What you can observe are proxies: rank movement over time, review velocity, listing edits, and sponsored placement frequency. Treat proxy signals as directional and label them as such in any internal write-up, because a forecast built on a proxy and presented as a fact becomes a liability the moment someone budgets against it.
Title Density and ABA Concentration: Measure How Competition Is Structured
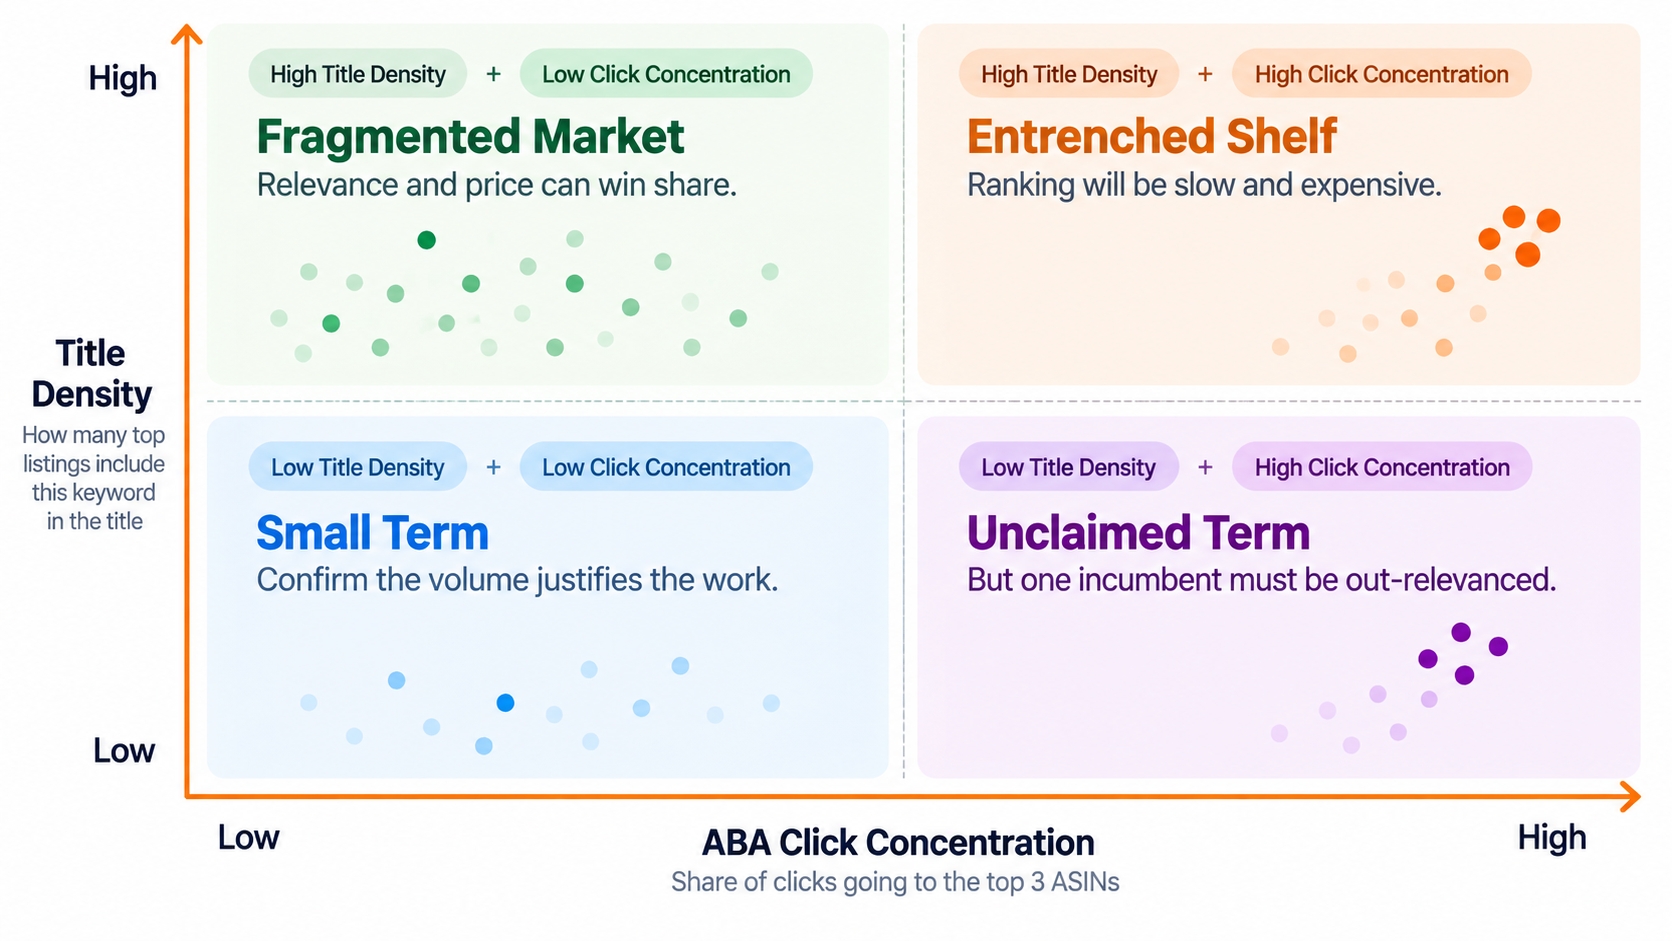
Competition has two layers, and title density and click concentration measure different ones. Density describes how the shelf is labeled; concentration describes how the traffic is distributed across it. Reading only one of the two produces either false optimism about an unclaimed term or unnecessary caution about a market that is actually fragmented and winnable.
Title Density Counts Listings, Not Keyword Repetitions
Title density counts how many listings in the analyzed result set include the keyword in their title rather than how many times the phrase appears. A single listing repeating the term three times still counts once. That distinction matters because density is a coverage measure across competitors, not a stuffing measure for one seller. Check how many results the tool sampled and whether it reviewed the first page of organic results or a broader block, since a wider sample mechanically raises the count.
Low Title Density Can Mean an Opening or a Poor Product Match
A low density figure is ambiguous on its own. It can mean the keyword is unclaimed and a well-optimized listing can take it cheaply, or it can mean the term simply does not describe the products that rank, so nobody bothered to add it. The tie-breaker is relevance: open the results page and confirm the listings shown are genuine competitors for your product. If they are not, low density is a warning sign rather than an invitation to optimize.
ABA Click Concentration Is Not Click-Through Rate
Click concentration describes how clicks for a search term are distributed across the ASINs shown, as a share-of-total measure. Click-through rate divides clicks by impressions for one ad or one listing. A market can show high concentration, with two ASINs absorbing most clicks, while your own CTR is low, high, or unknown. Use concentration to judge how hard the shelf is to crack, and use your own advertising reports to judge how well you are performing inside it.
Read Title Coverage and Click Concentration Together
Two dimensions produce four practical situations, and each one calls for a different response. The matrix below is the version we use most often when triaging a reverse ASIN export, because it separates a hard market from a merely crowded-looking one. When the two signals disagree, trust the one that costs more to change — concentration usually moves slower than title coverage, since you can edit a title this afternoon but you cannot edit twenty years of reviews in a weekend.
| Title density | Click concentration | What it usually means |
|---|---|---|
| High | High | Entrenched shelf; ranking will be slow and expensive |
| Low | High | Unclaimed term, but one incumbent must be out-relevanced |
| High | Low | Fragmented market; relevance and price can win share |
| Low | Low | Small term; confirm the volume justifies the work |
Organic Rank, SP Rank, and Sponsored ASINs: Separate Presence From Performance
Rank data tells you where a listing was seen, not how it performed. Separating observation from inference is the single most useful discipline when you read organic rank, SP rank, and sponsored ASIN columns, because those fields look like results and behave like snapshots. Four habits keep the two from being confused in your reporting.
Organic Rank and SP Rank Describe Different Observed Placements
Organic rank is the position in unpaid search results for a keyword at a given moment and location. SP rank is the position within sponsored placements, which is decided by an auction that responds to bids, budgets, relevance, and ad quality, and shifts by daypart and audience. A listing can hold a strong organic position and appear in no sponsored slot at all, or appear sponsored on page one while sitting deep in organic results. Log both, and treat them as separate channels feeding the same detail page.
Sponsored ASINs and PPC Bid Do Not Reveal a Competitor's Budget
Seeing that a competitor appears in sponsored results for a keyword tells you they are participating, nothing more. Spend equals clicks multiplied by cost per click, and neither value is public. Bid benchmarks published inside any keyword tool describe typical competition for that term, not what a specific seller pays, and they move with seasonality and category shifts. If a stakeholder asks for a competitor's exact ad budget, the accurate answer is that it cannot be observed from outside the account.
Match Type Is Not the Same as Broad, Phrase, or Exact Targeting
Some tool columns use match-type language to describe how the tool matched keywords to a listing, which is a research convention, not an advertising setting. That is not the advertiser's chosen targeting. A competitor may appear for a term through broad or phrase match, through product targeting, or through automatic campaigns. Do not conclude that a seller runs exact match on a keyword simply because a research table labels the relationship that way.
Not Observed Is Not the Same as Not Indexed
Crawls happen at intervals, from specific locations, sometimes without login, and to a limited depth. A keyword missing from one export can appear in the next, and a sponsored placement can vanish because a campaign paused rather than because a listing was rejected. Before recording a gap as a finding, re-run the check, widen the device or location setting, and confirm whether the listing is indexed by searching the exact phrase yourself.
Impr. Share and Keyword Distribution: Read SellerSprite's Percentage Metrics Correctly
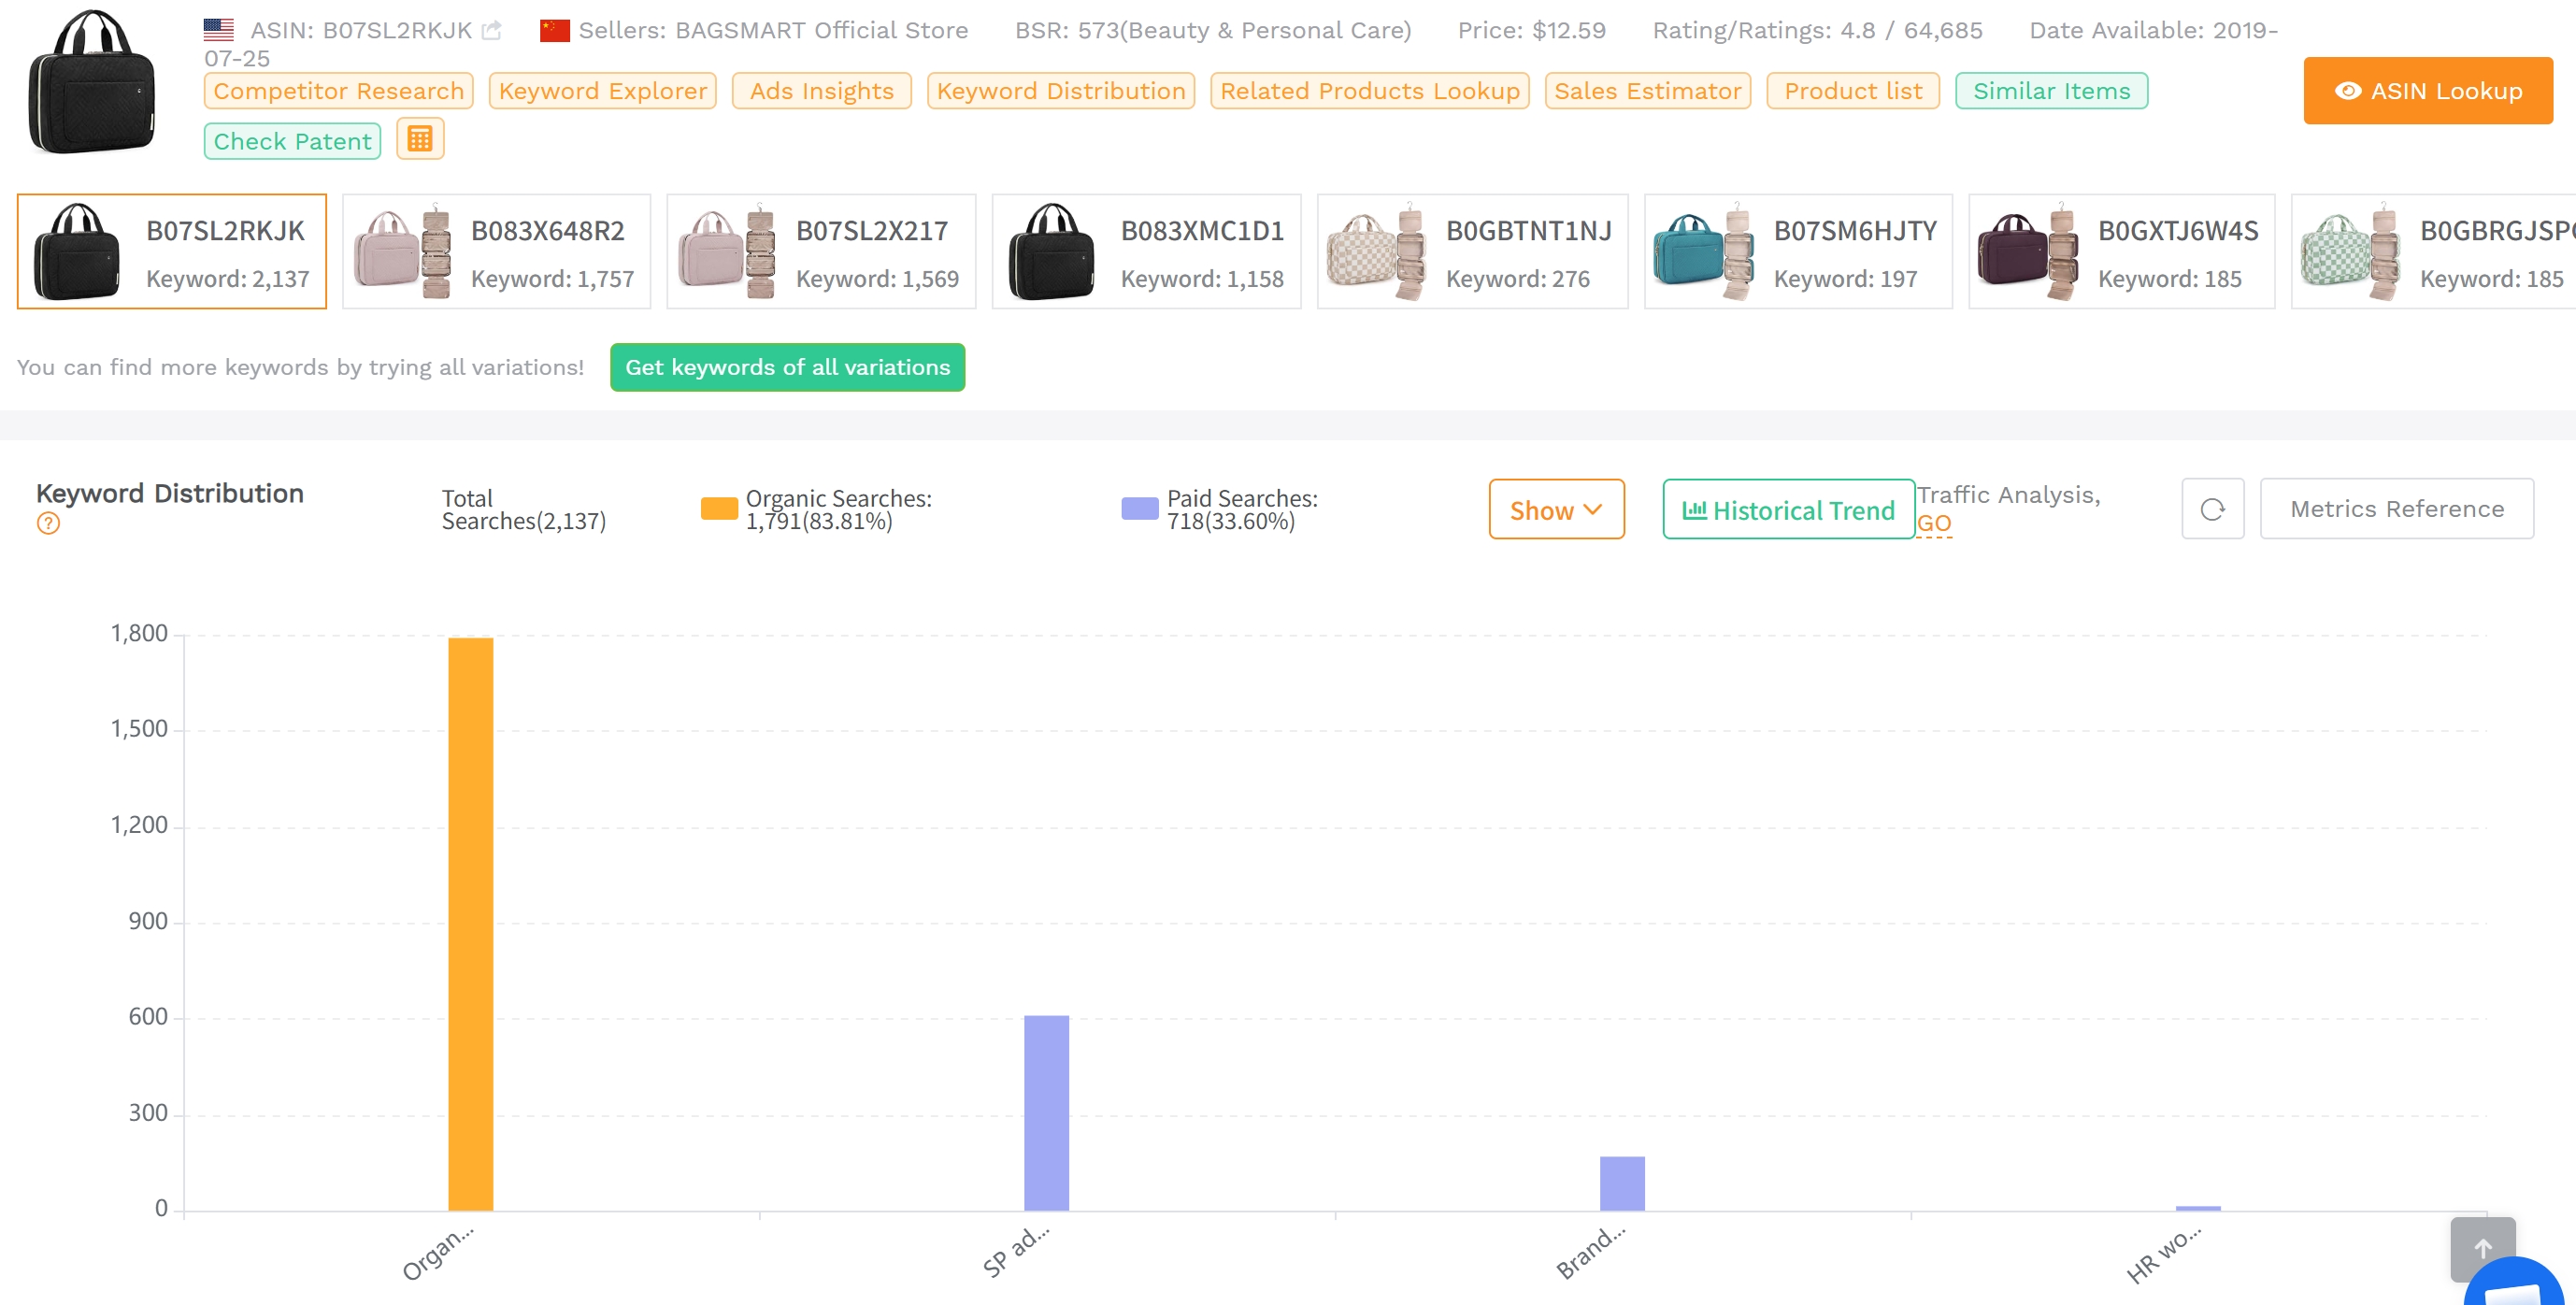
Percentage columns are the most quoted and the most misread figures in any reverse ASIN export. Two percentage columns sitting side by side can describe completely different denominators, and adding them together is a common and expensive error. Three reading rules cover most of the confusion.
Impr. Share Describes a Keyword's Contribution to the Analyzed ASIN
In this context, share metrics describe how much a keyword or placement contributes to the analyzed ASIN's measured activity in the selected window (impressions, traffic, or sales), depending on the column. That is a within-ASIN share, not a share of the whole marketplace. A keyword with a large Impr. Share is not claiming a large slice of Amazon; it is saying that a large slice of this listing's measured impressions in that window traces back to that keyword. Confirm the denominator in the tooltip before you quote it to anyone.
Organic and Sponsored Keyword Percentages Can Overlap
The same search term can send both organic and sponsored traffic to the same ASIN on the same day. If you add the organic percentage column to the sponsored percentage column and expect the total to reach 100%, you will regularly produce sums above 100% and conclusions to match. Read them as two channels that share a term, and evaluate them separately: organic share speaks to ranking strength, sponsored share speaks to paid visibility and, indirectly, to auction pressure.
A Larger Share Does Not Always Mean More Total Exposure
Shares are relative, so they compress scale out of the picture. A 45% share of a modest total can represent a smaller absolute opportunity than a 12% share of a very large one. Always pair a percentage with the underlying total (search volume, listing impressions, or keyword sales) before prioritizing. If the tool does not expose that total in the same view, mark the share as directional and look for the base elsewhere in the export rather than assuming the bigger percentage is the bigger prize.
Percentage sanity check. For every percentage column, answer three questions before using it: share of what (impressions, clicks, sales)? Over which window? For which ASIN or variation scope? If you cannot answer all three from the tooltip, treat the figure as context, not as evidence.
Three Keyword Profiles: How to Act When Metrics Disagree
When metrics disagree, averaging them produces mush; diagnosing them produces decisions. These three profiles cover most of the ambiguous rows you will encounter in a US reverse ASIN export, and each one has a different default action. Use them as triage rules rather than verdicts, and your category, price point, and review base always get the final word.
High DSR, High Click Concentration: Investigate Before Expanding
This pairing means demand looks generous relative to supply, yet a small group of ASINs absorbs most of the clicks. Common causes are entrenched incumbents with deep review moats, a market where price is the deciding factor, or a term whose searchers are brand-loyal. Investigate the top three listings' review counts, price bands, listing age, image quality, offer structure, and run a limited sponsored test before committing inventory. This is a keyword to study, not a keyword to launch into.
Low SPR, Weak Product Fit: Reject the False Opportunity
A low SPR suggests the keyword is easy to rank for, which reads like a green light on a crowded dashboard. But if your product does not match the search intent, such as wrong size, wrong use case, wrong style, or wrong buyer, you will rank and then watch the traffic leave without buying. Rank is not demand capture. Put the relevance gate ahead of the feasibility gate, so an attractive score can never override a product mismatch.
Moderate Demand, Strong Product Fit: Validate With Your Own Performance Data
The strongest candidates are rarely the biggest keywords. They are the terms where your imagery, price, and review base give searchers a clear reason to choose you over the incumbents. Validate by checking Search Query Performance for the term, reviewing search-term reports for early impressions and clicks, and watching whether add-to-cart rate holds as the keyword's traffic scales. If your own funnel agrees with the estimate, scale; if it disagrees, the estimate was directional and relevance or price is the explanation.
Move From Familiar Cerebro Filters to a SellerSprite Decision Workflow
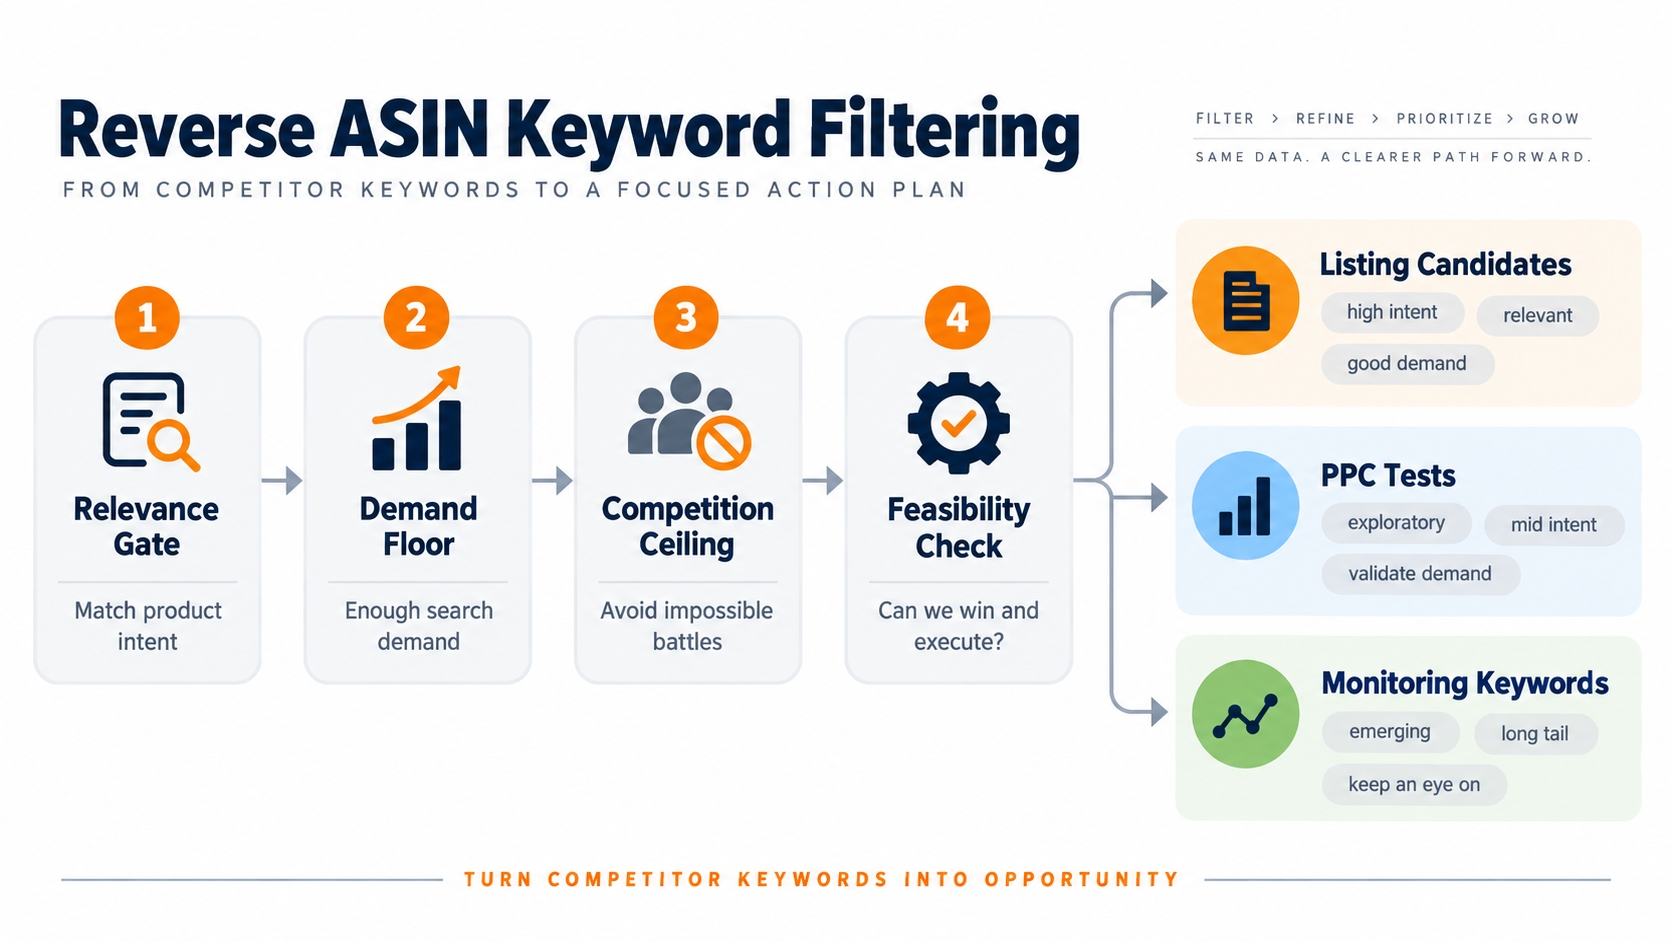
The point of the mapping is not to rename columns; it is to run a decision process that survives the next data refresh. The workflow below replaces a copied Cerebro filter with a sequence you can apply to any SellerSprite reverse ASIN export, and to the next tool your team adopts. It has four steps and one governing rule: relevance always runs first.
Apply Relevance Before Demand and Competition Filters
Start with the question every other filter depends on: does this keyword describe what I sell? Build the relevance gate first, then apply a demand floor, then a competition ceiling using title density and DSR, and finish with a feasibility check using SPR. Reversing the order as sorting by search volume and then hunting for relevance is how sellers end up with keyword lists that look impressive in a spreadsheet and convert nowhere on the listing.
Separate Listing Candidates, PPC Tests, and Monitoring Keywords
One export usually contains three different jobs. Listing candidates go into titles, bullets, and backend fields because they are both relevant and reachable. PPC test candidates are terms where a modest budget buys learning quickly, even if organic ranking is still far off. Monitoring keywords are brand terms, competitor terms, and terms where you already rank and want movement alerts. Tagging rows by job prevents you from optimizing a monitoring keyword as if it were a launch target.
Validate the Shortlist With Search Query Performance and Advertising Reports
SellerSprite's estimates tell you where to look; your own account tells you what is true. Search Query Performance shows the market funnel for a query against your ASIN, including impressions, clicks, cart adds, and purchases, while search-term reports show what you actually paid and earned. When an estimated opportunity and your real conversion data disagree, trust your account and note the divergence; it usually points at relevance, price, or offer structure rather than a broken data source.
Save the Filter Logic, Not a Universal Score Cutoff
Scores get recalibrated, models get updated, and categories behave differently, so saving a permanent numeric rule guarantees a stale list. Save the logic instead — relevance gate, volume floor, density ceiling, SPR ceiling, price and review reality check — and re-tune the numbers each time you refresh or enter a new category. That is the part that transfers across tools, marketplaces, teammates, and whatever dashboard you use two years from now.
Starter checklist for a fresh export
- Confirm marketplace, time window, and parent-versus-child scope before reading any column.
- Apply the relevance gate and delete everything that fails it, no matter how attractive the score.
- Set a demand floor from your own benchmark keywords, not from a blog post threshold.
- Screen competition with title density plus DSR, and flag any row where the two disagree.
- Rank the survivors by SPR, then subtract points for review moats and price gaps.
- Tag every row as listing candidate, PPC test, or monitoring keyword, then validate before scaling.
FAQ
Does SellerSprite Have a Cerebro IQ Score?
No. SellerSprite does not publish a metric labeled Cerebro IQ Score, and there is no conversion formula between the two scores. What it offers is a functionally related signal: DSR, a demand-to-supply ratio that, combined with a relevance gate and a search-volume floor, supports the same shortlisting decision. Treat DSR as an answer to the question Cerebro IQ Score was asking, not as a number to copy, and confirm the current definition in the in-app glossary before you set any threshold on it.
Is SellerSprite SPR the Same as Helium 10 CPR?
They answer the similar question of roughly how much sales velocity is needed to reach a top half of page-one / page-one organic position, but they are not the same calculation. Target position, ASIN scope, marketplace, and the underlying historical model can all differ, so identical values should not be expected and differences do not automatically mean one tool is wrong. Compare them only within the same marketplace, keyword, ASIN scope, and comparable target position, and use both as relative difficulty rankings rather than absolute requirements.
What Is a Good DSR or Title Density for My Product?
There is no universal threshold, and anyone quoting one is describing their category rather than yours. A workable approach is to benchmark: export twenty to thirty keywords you already rank for and convert on, then read the DSR and title density values they hold. Those values define a realistic band for your product, price point, and review base. Re-benchmark whenever you enter a new category, because supply and search behavior change faster than most sellers expect.
Why Do Cerebro and SellerSprite Show Different Numbers for the Same Keyword?
Usually because of scope rather than error. Data sources, marketplace coverage, time windows, ASIN aggregation, sampling depth, smoothing rules, and update cadence all differ between tools, and each of those choices moves a number. Before concluding a figure is wrong, verify that both values describe the same marketplace, the same period, and the same parent or child ASIN scope. If they do and the values still differ, treat the gap as model variance and make decisions on direction and magnitude rather than on decimals.
Can Reverse ASIN Metrics Reveal a Competitor's Exact Sales or Ad Spend?
No. Reverse ASIN tools estimate market-level demand and record observed placements; they do not have access to another seller's order count, conversion rate, or campaign spend, because those figures exist only inside that seller's account. Any number presented as a competitor's exact ad spend is an inference dressed as a fact. What you can legitimately track are proxies, such as rank movement, review velocity, price changes, and sponsored placement frequency, and you should label them as proxies in every forecast or report.
Next Steps
- Open SellerSprite's Reverse ASIN tool and run the ASIN you are studying in the US marketplace, with the parent and child scope set the way you actually sell.
- Rebuild your saved Cerebro filter as logic — relevance gate, volume floor, density and DSR ceiling, SPR ceiling — and recalibrate the numbers against keywords you already convert on.
- Validate the shortlist with Search Query Performance and your advertising search-term reports before you change a title or commit to inventory.
- Re-read the reverse ASIN strategy guide for the wider methodology, and the reverse ASIN search walkthrough for the mechanics.
- Save your filter logic as a reusable template so the next export takes minutes instead of an afternoon.
References
- SellerSprite — Reverse ASIN strategy guide View
- SellerSprite — How to perform a reverse ASIN search View
- Helium 10 — Cerebro Usage Guide View
- Amazon — Search Query Performance View
Metric definitions in third-party tools are proprietary and may change without notice. Verify current formulas, target positions, and calculation windows inside each tool's in-app documentation before publishing thresholds or budgets that depend on them.
By SellerSprite Success Team
The SellerSprite Success Team combines deep Amazon marketplace expertise with data science to help sellers grow profitably. With years of experience in e-commerce analytics, we focus on ethical, sustainable strategies that align with Amazon's evolving algorithms and policies. Our insights are trusted by thousands of sellers worldwide.